Subscribe to RSS

Changelog

The latest product launches and feature updates from Stealed.

New

Infostealer-compromised machine analysis

Every infostealer leak tied to the machine that produced it: timeline, still-active sessions and impacted domains, in the cockpit, the list and the API.
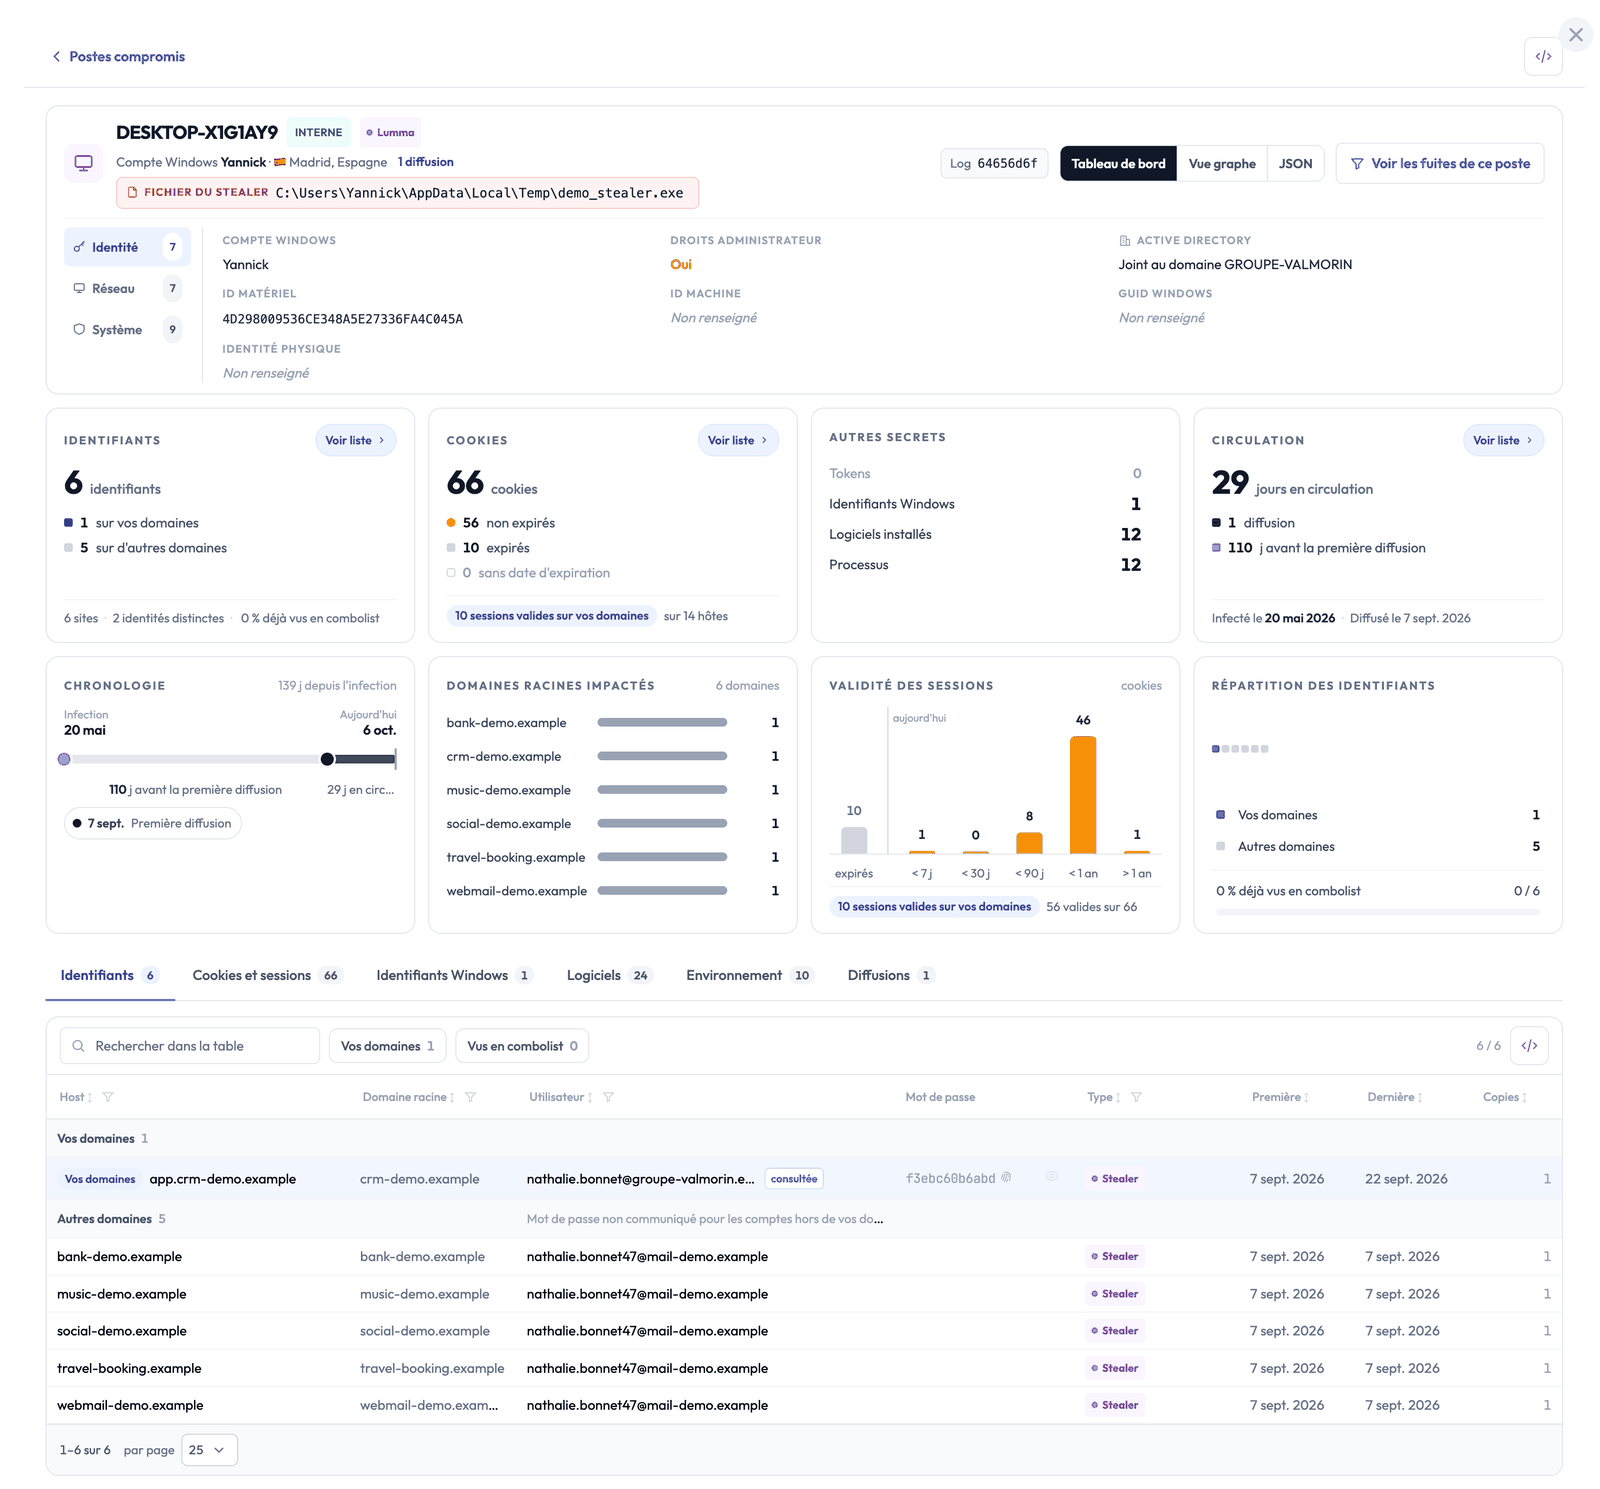
Full view of a compromised machine in Stealed, with demo data: identity, indicators, timeline, sessions, domains and log content

A credential stolen by an infostealer never travels alone. The infected machine usually leaked dozens of other accounts, session cookies that still work and a trace of everything installed on it. Until now Stealed showed you those credentials one by one. Infostealer-compromised machine analysis ties them to the machine that produced them.

In your cockpit

A new indicator counts the distinct compromised machines linked to your domains: your employees’ and those of your customers or visitors, the new ones over 30 days, the ones joined to a corporate domain and the ones with a session still active. Copies of the same log, resold or collected again, are grouped: a machine is counted once.
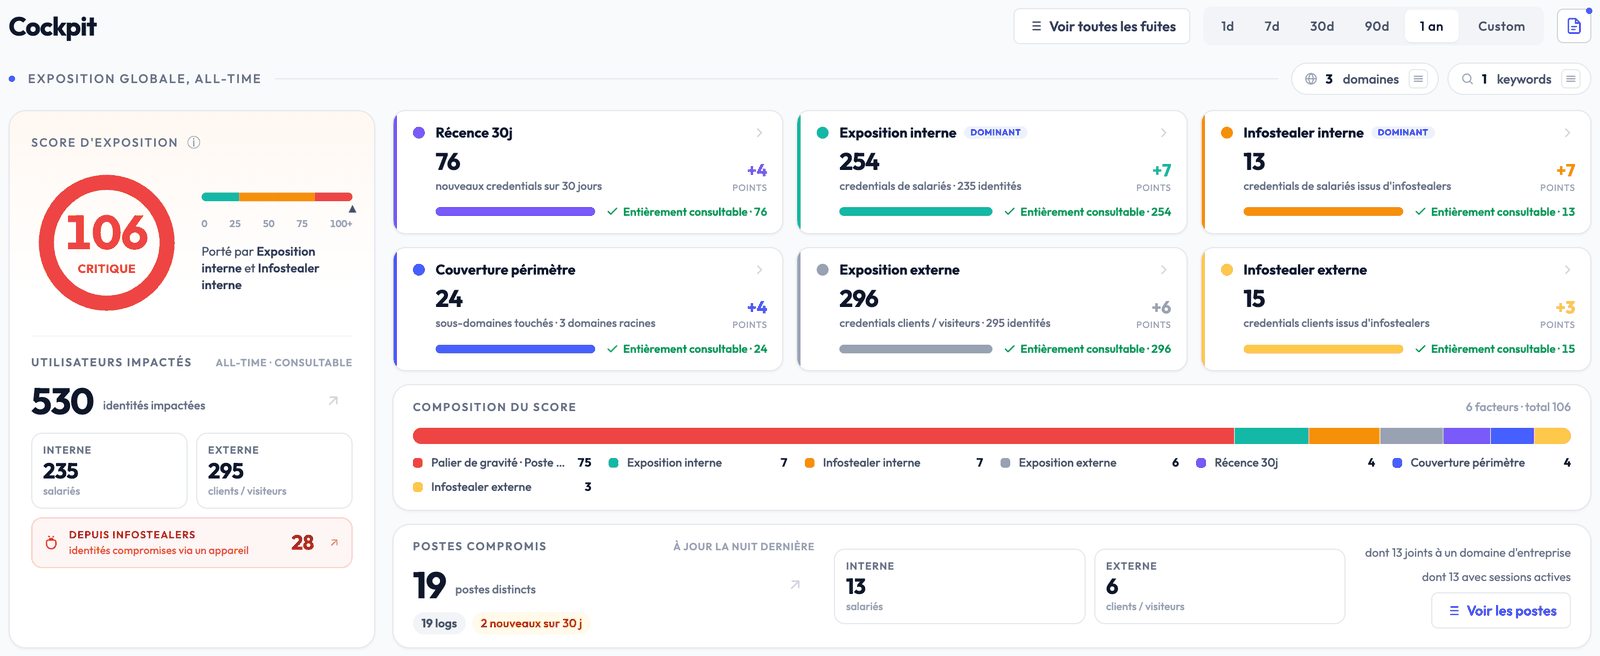
A client's cockpit with the Compromised machines block: distinct machines, internal and external, new over 30 days, domain-joined and with active sessions

The machine list

All your compromised machines on one page, internal first, sortable by infection or publication date, filterable by scope, infostealer family, country, publication date and unexpired sessions. A row opens the machine sheet.
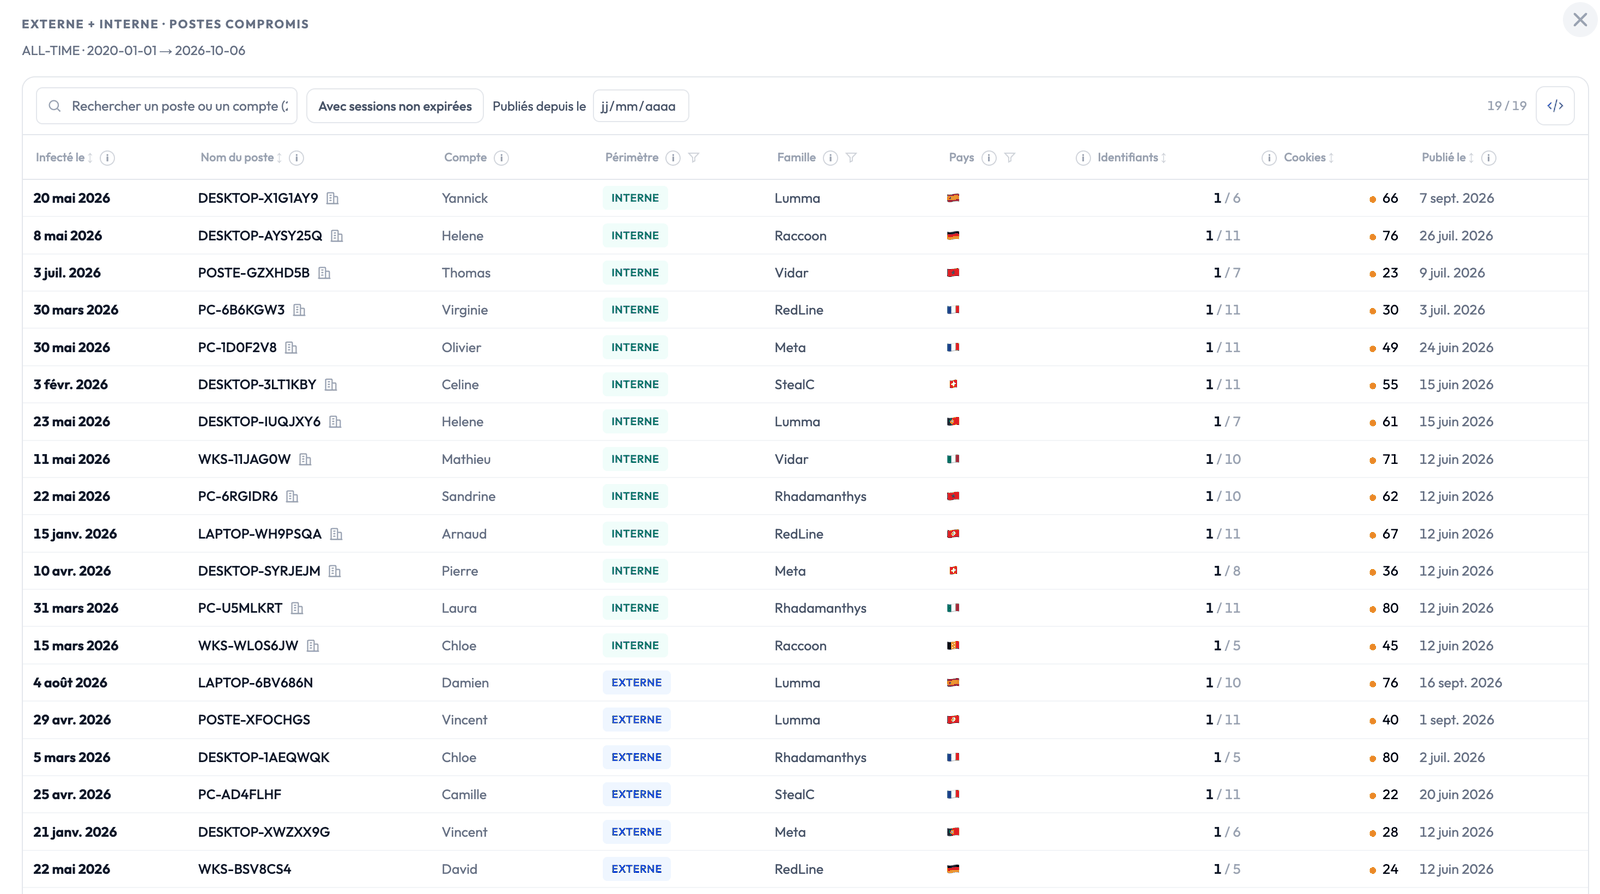
List of a client's compromised machines: infection date, machine name, account, scope, family, country, credentials, cookies and publication date

The machine sheet

Every machine has its sheet: its identity (Windows account, administrator rights, Active Directory domain, hardware identifiers), then everything its log holds, section by section.
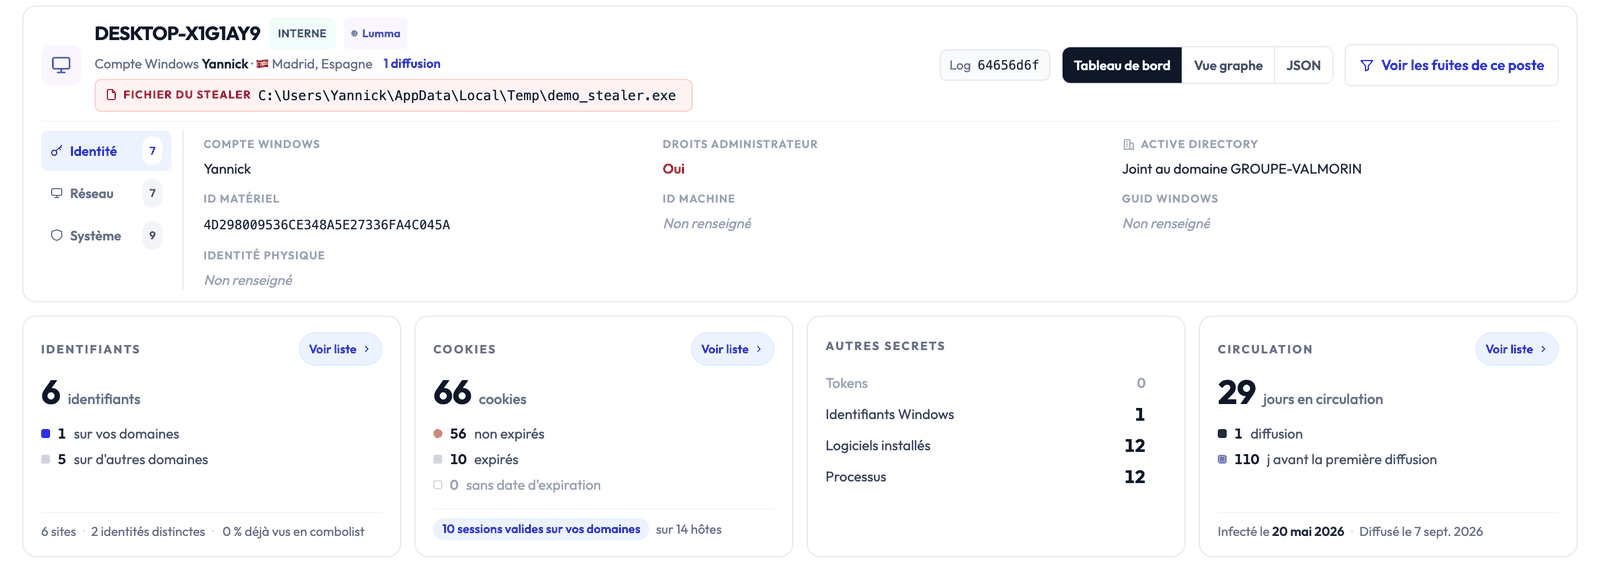
Top of a machine sheet: machine identity, credentials, cookies, other secrets and circulation

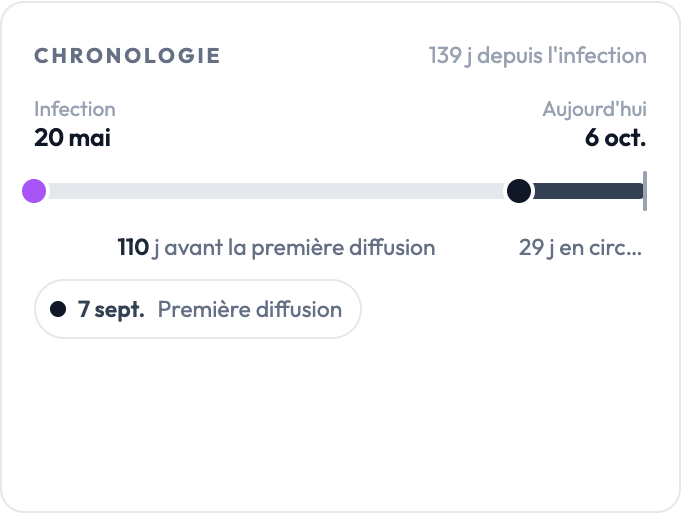
Timeline of an infection, from the machine being infected to its first release
The whole story of the infection. From the machine being infected to its release on criminal sources: the delay before the first publication, the re-releases and what each one added.
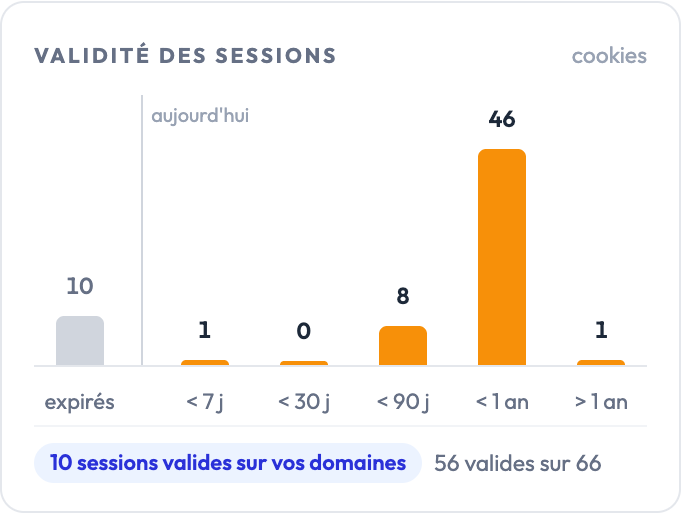
Validity of the stolen sessions, sorted by expiry date
Sessions still usable. Stolen cookies sorted by expiry date, with the ones still valid on your domains brought forward: those open an account without a password.
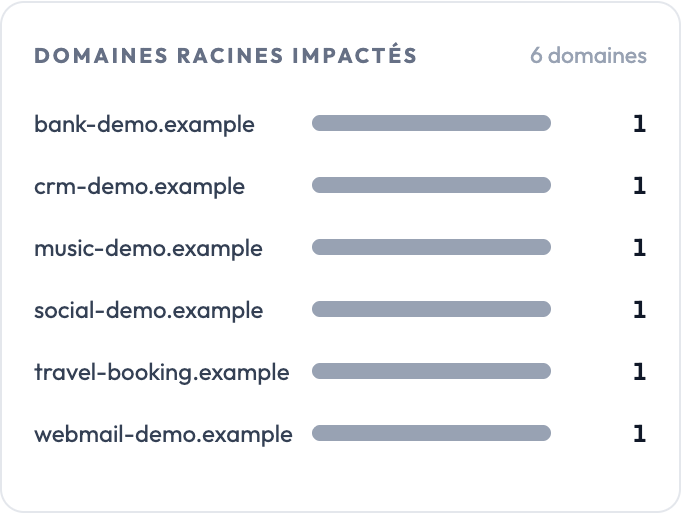
Root domains hit by a machine, with the number of stolen credentials for each
The real extent of the exposure. Every domain hit by the machine, yours first, with the number of stolen credentials for each.

Everything the log holds

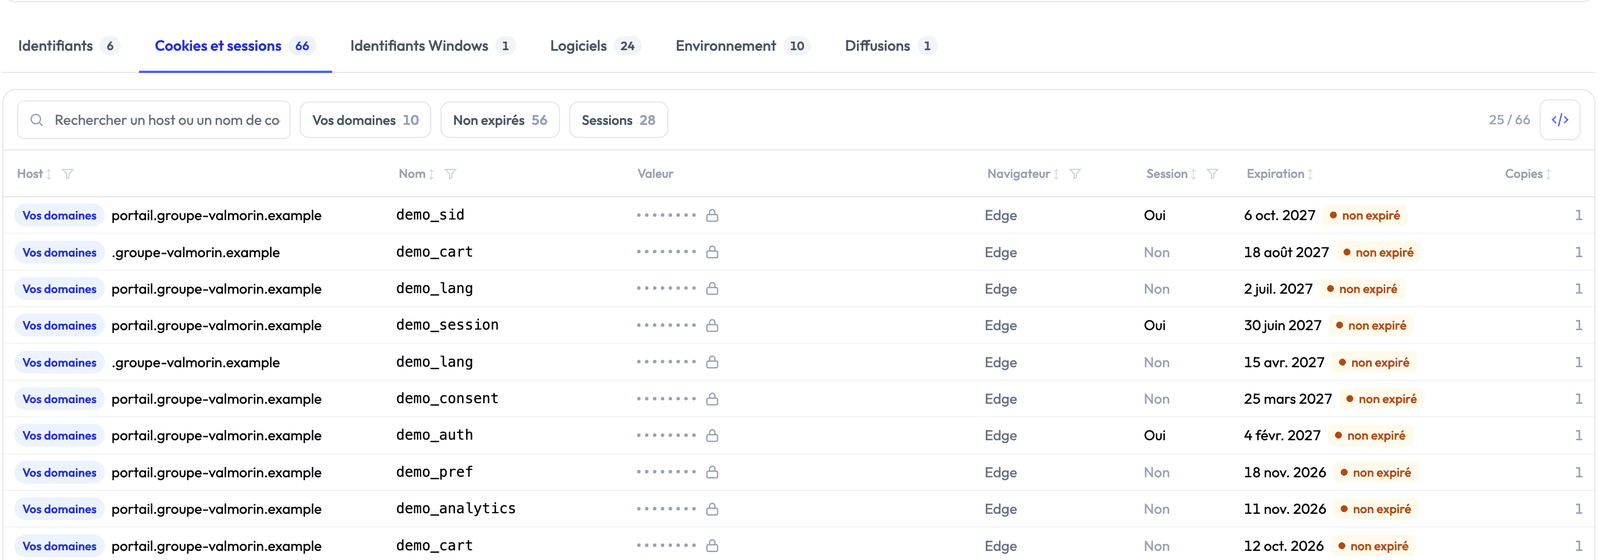
Below the sheet, every section of the log has its table: credentials, cookies and sessions, Windows credentials, installed software, machine environment and releases. Passwords and cookie values stay masked, and for accounts outside your domains the password is never disclosed.
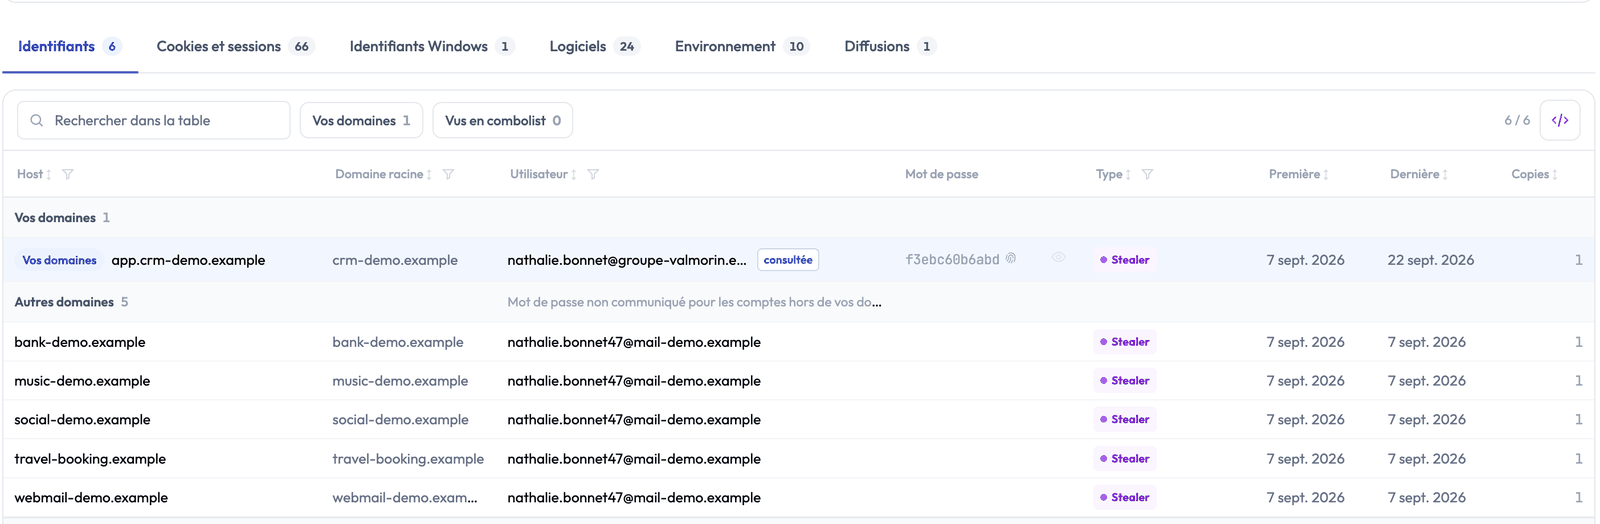
Credentials tab of a machine: your domains first, then other domains, password masked or not disclosed

Cookies and sessions tab of a machine: host, name, masked value, browser, session and expiry date

One click on a row opens the leak detail without leaving the machine.
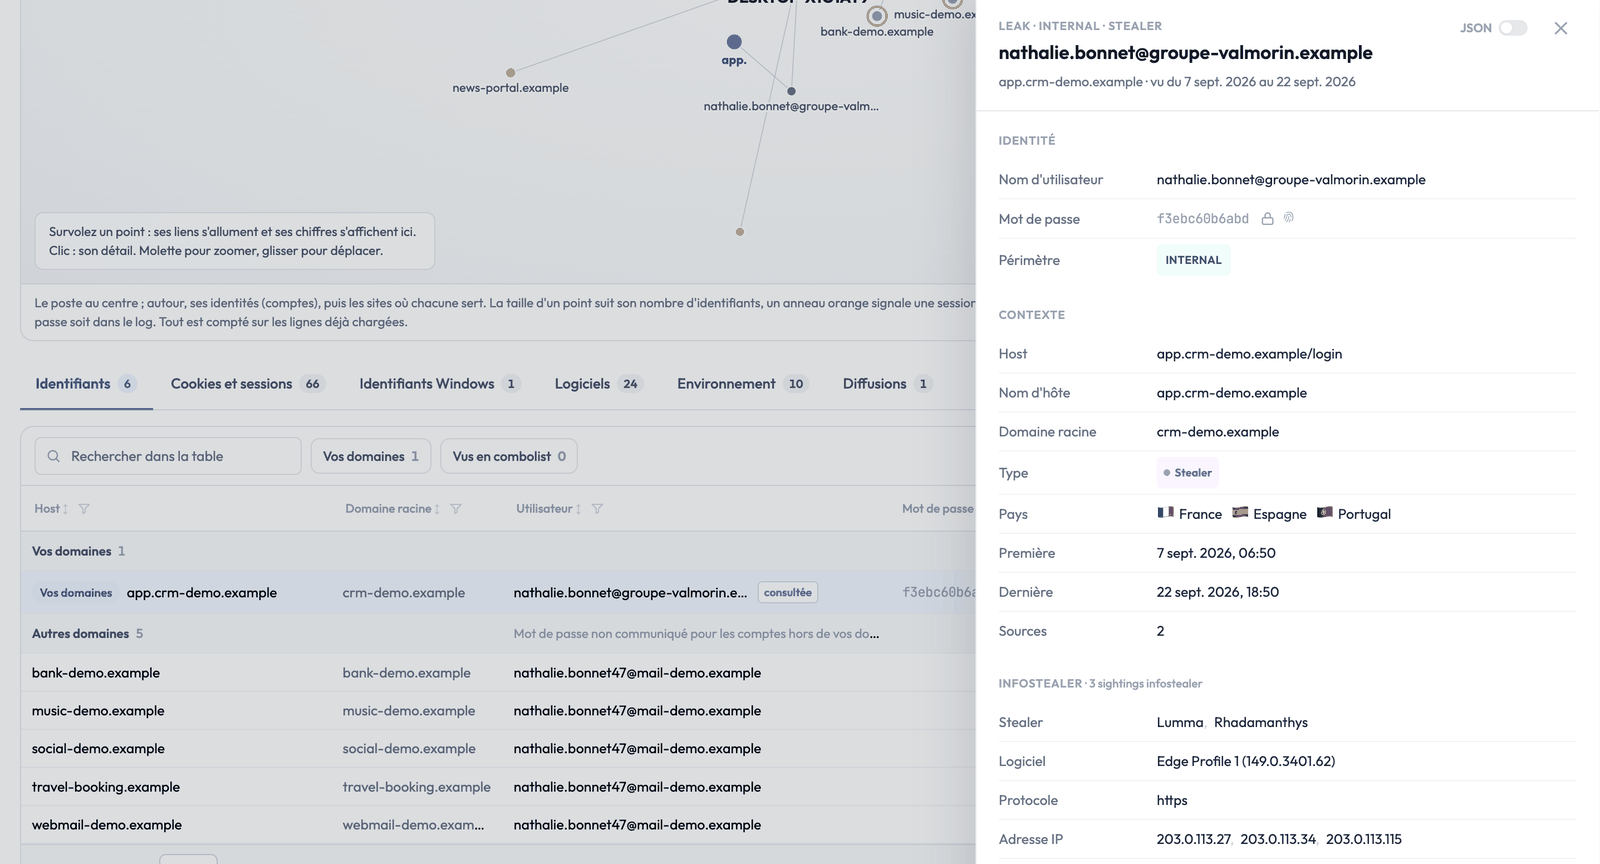
Leak detail opened from the Credentials tab of a machine

The graph view

The same sheet, drawn: the machine in the centre, its identities around it, then the sites where each one is used. An orange ring flags a session that is still valid. Hover a point to light up its links, click it for its detail.
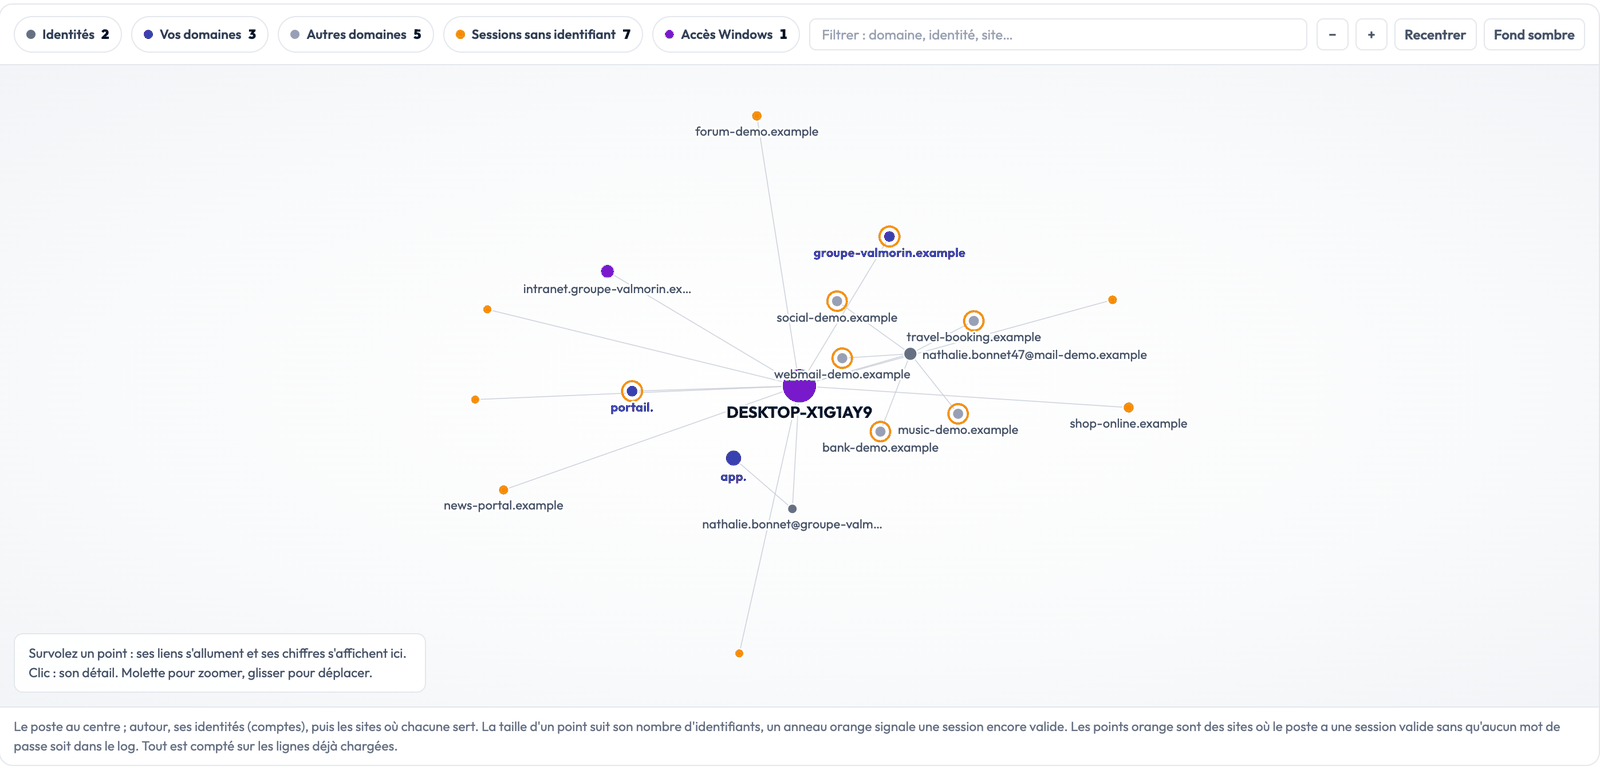
Graph view of a compromised machine: the machine in the centre, its identities and the sites where each one is used

From a leak to the machine, and back

In your leak lists, the detail of a credential stolen by an infostealer now shows the infected machine: “View the machine” opens its sheet, “Filter on this machine” keeps only its leaks. From the sheet, “View this machine’s leaks” goes the other way.
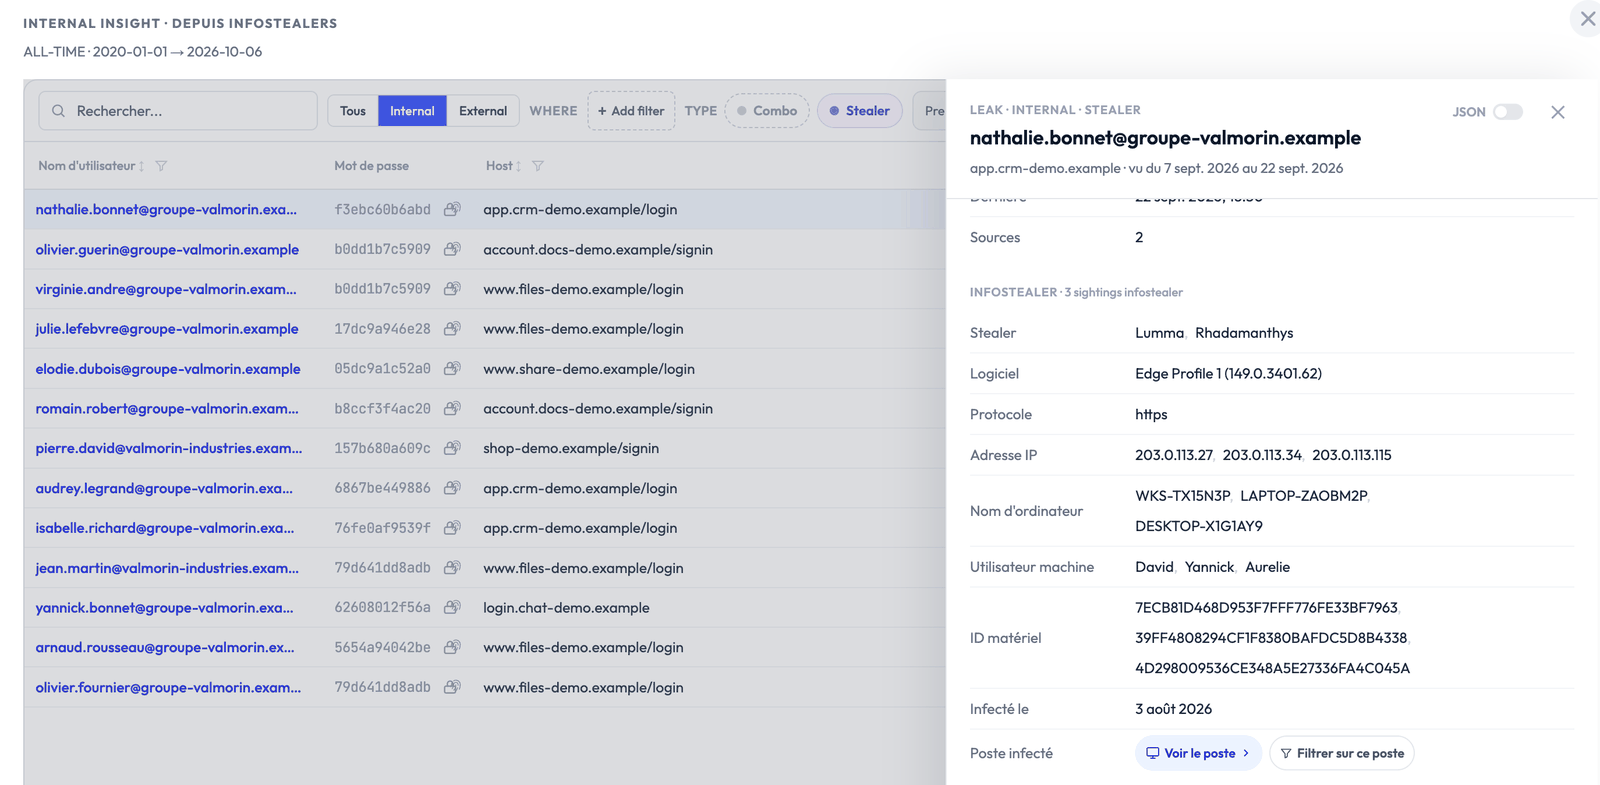
A client's infostealer leak list and the detail of a credential, with the infected machine and its two buttons

Through the API

Compromised machines and their sheets are available through the API to feed your tools (SIEM, ticketing, reports), for instance to open a ticket for each machine holding an employee credential. Every view shows the matching call, ready to copy in Bash, Python or JavaScript. Secrets never leave through the API.
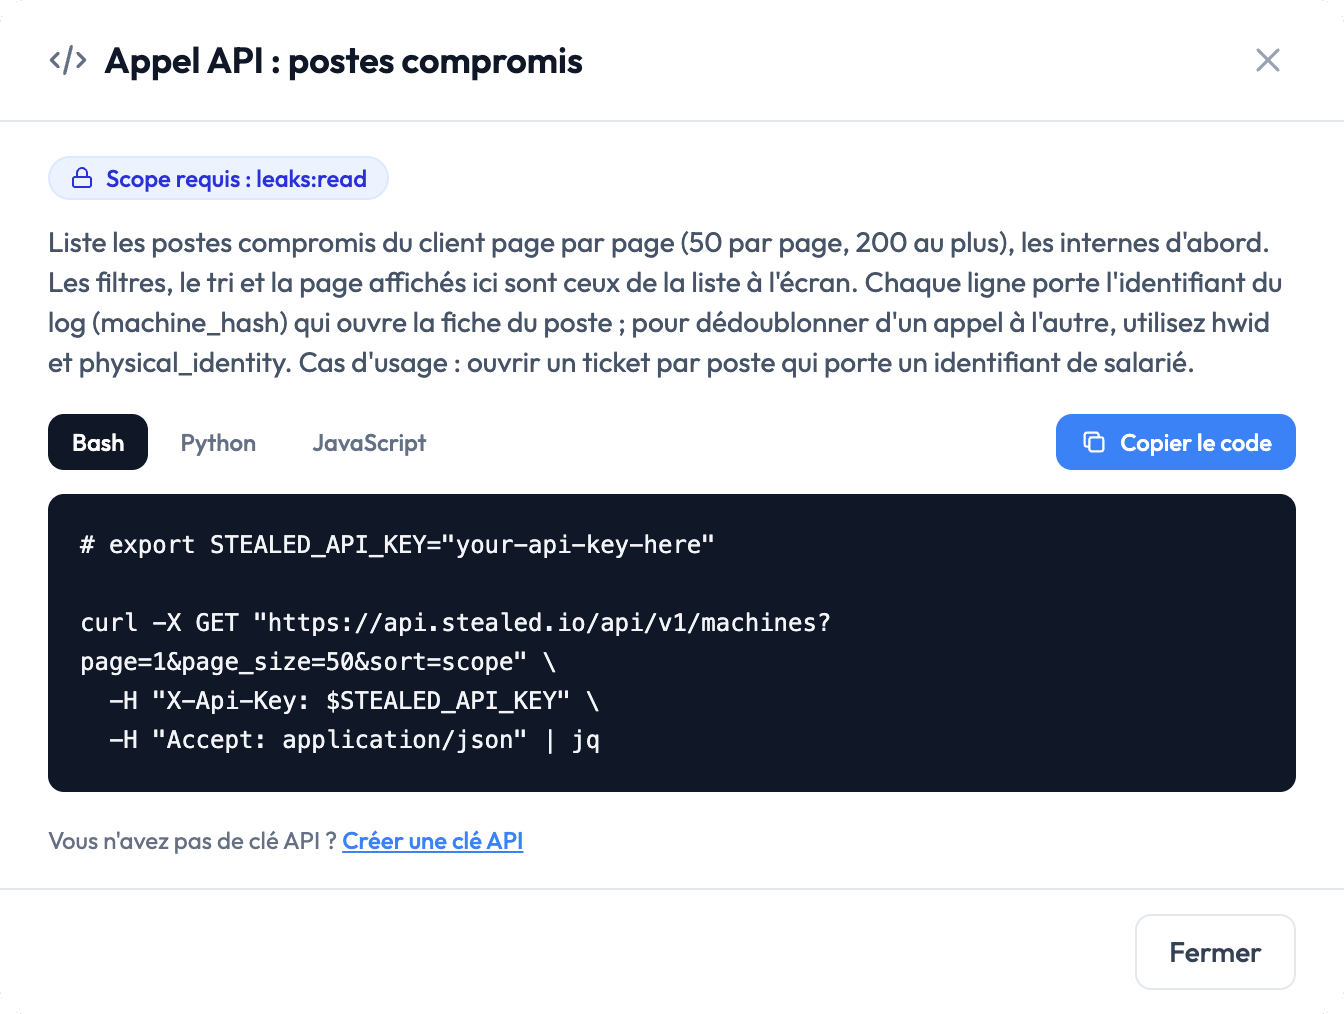
API call window of the compromised machine list, with the Bash example

Your data stays protected

Passwords and cookies are masked by default. They are revealed on demand only, one at a time, and every reveal is logged. No password is ever shown for an account outside your domains.

Availability

The module is already enabled in your workspace, nothing to request: open your cockpit, the Compromised machines block is waiting for you there.

The screenshots on this page come from a demo workspace: companies, domains, machines and accounts are fictional.
New

Cockpit: your exposure, at a glance

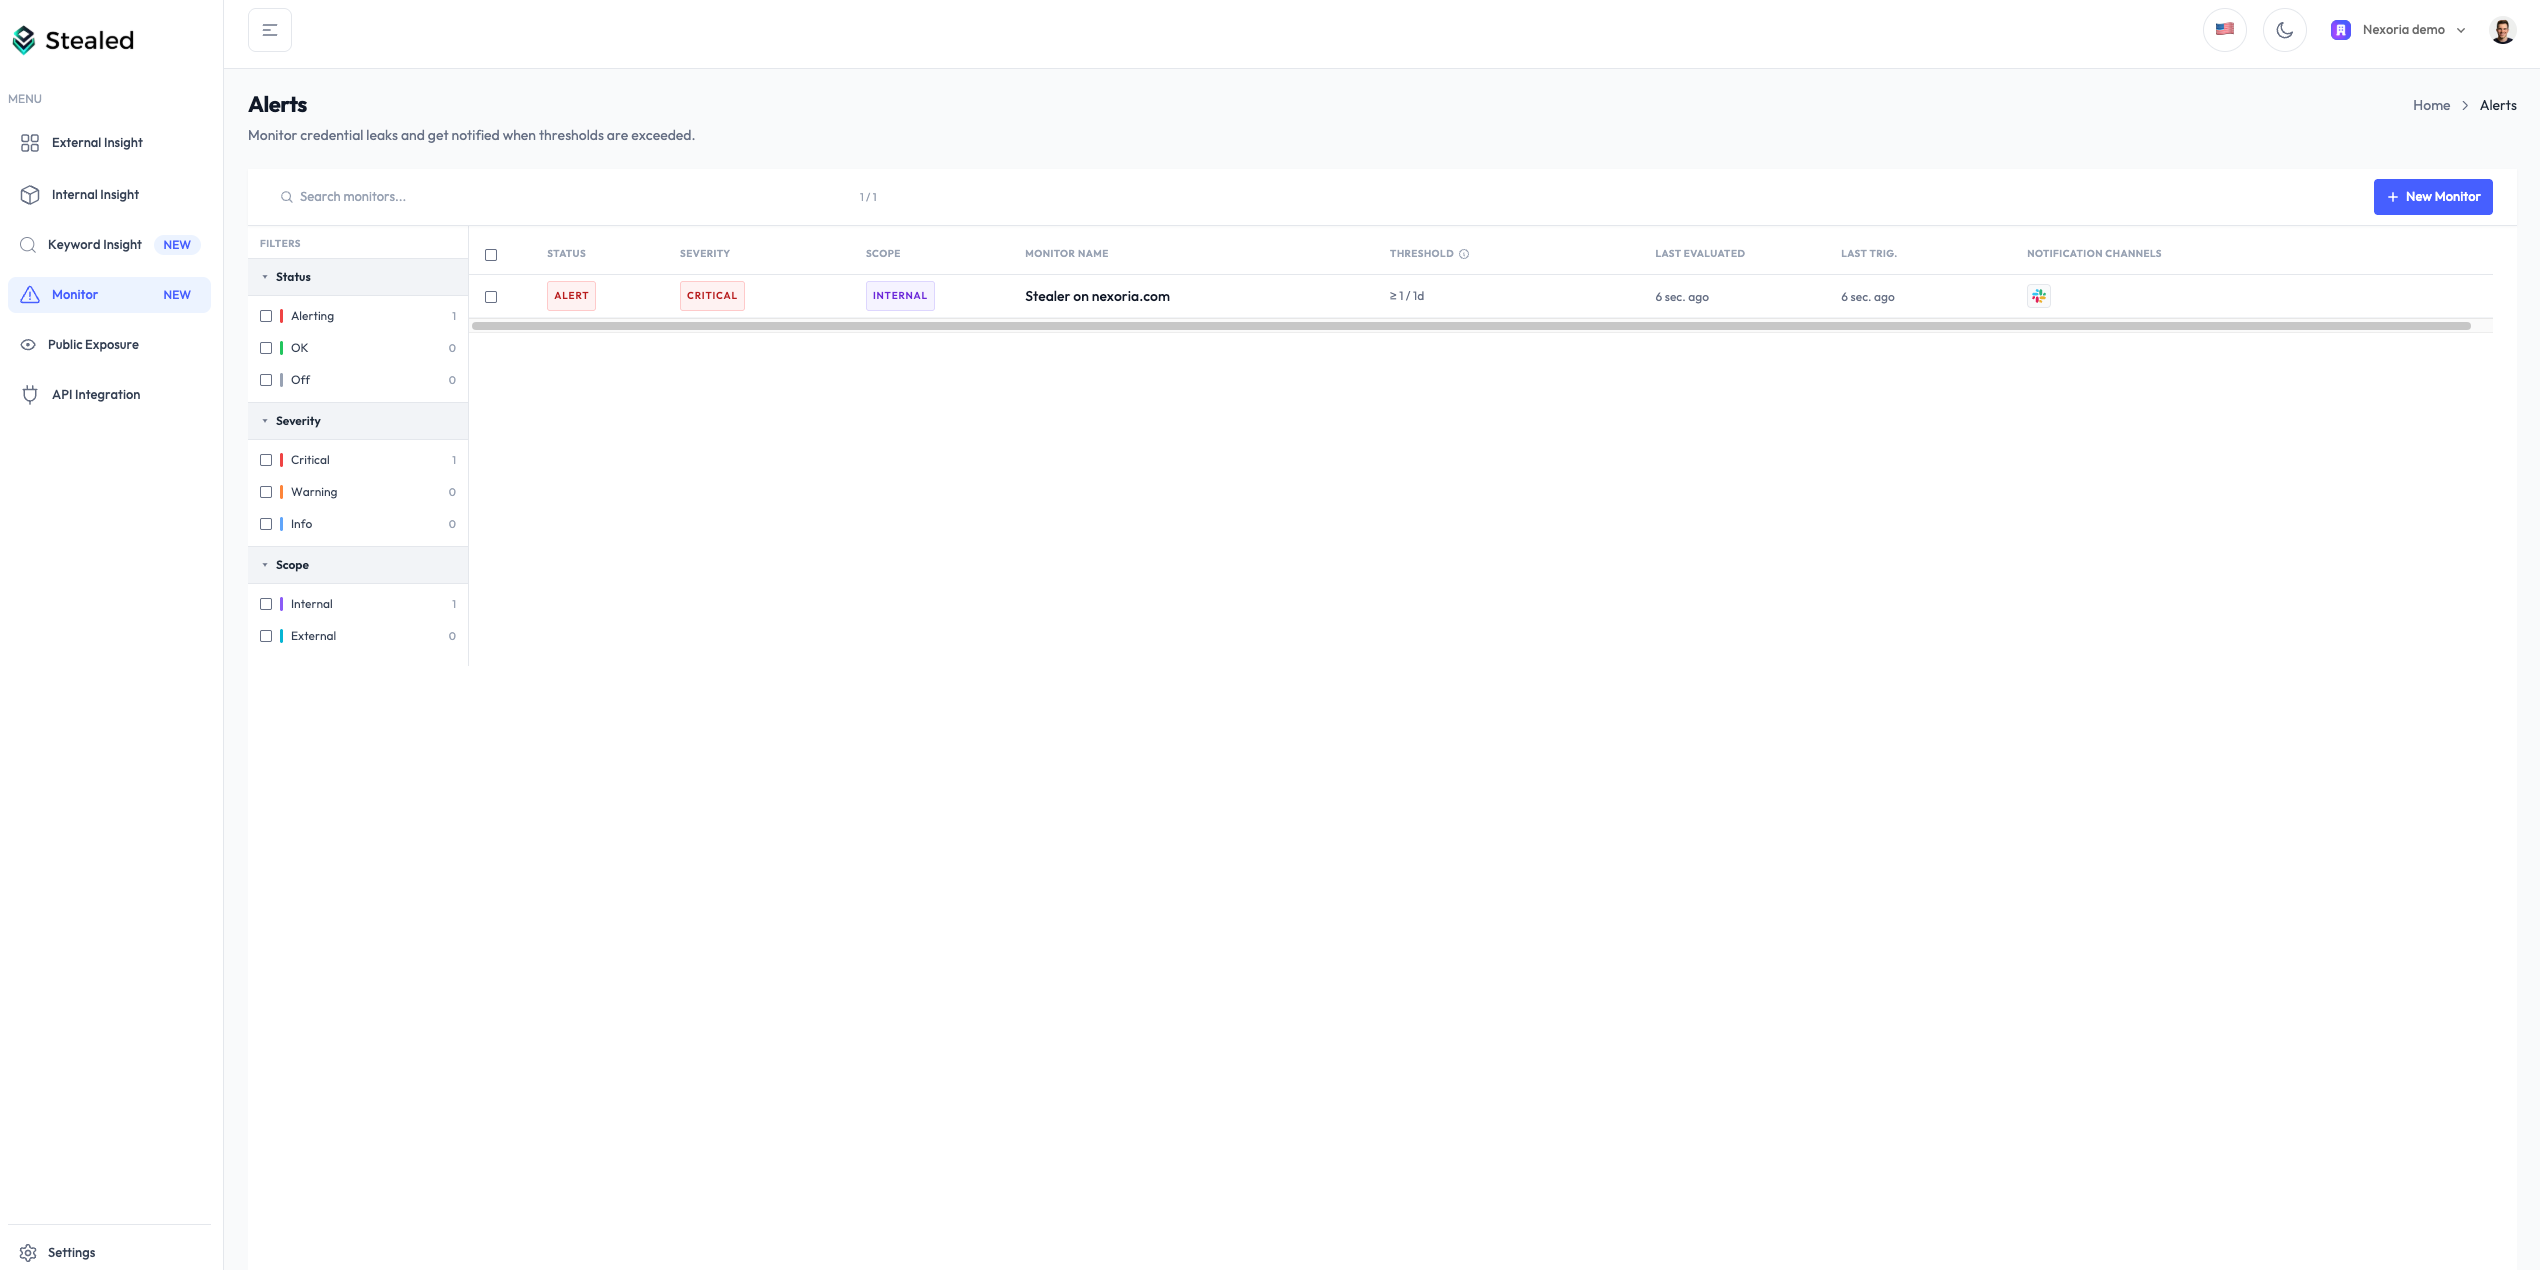
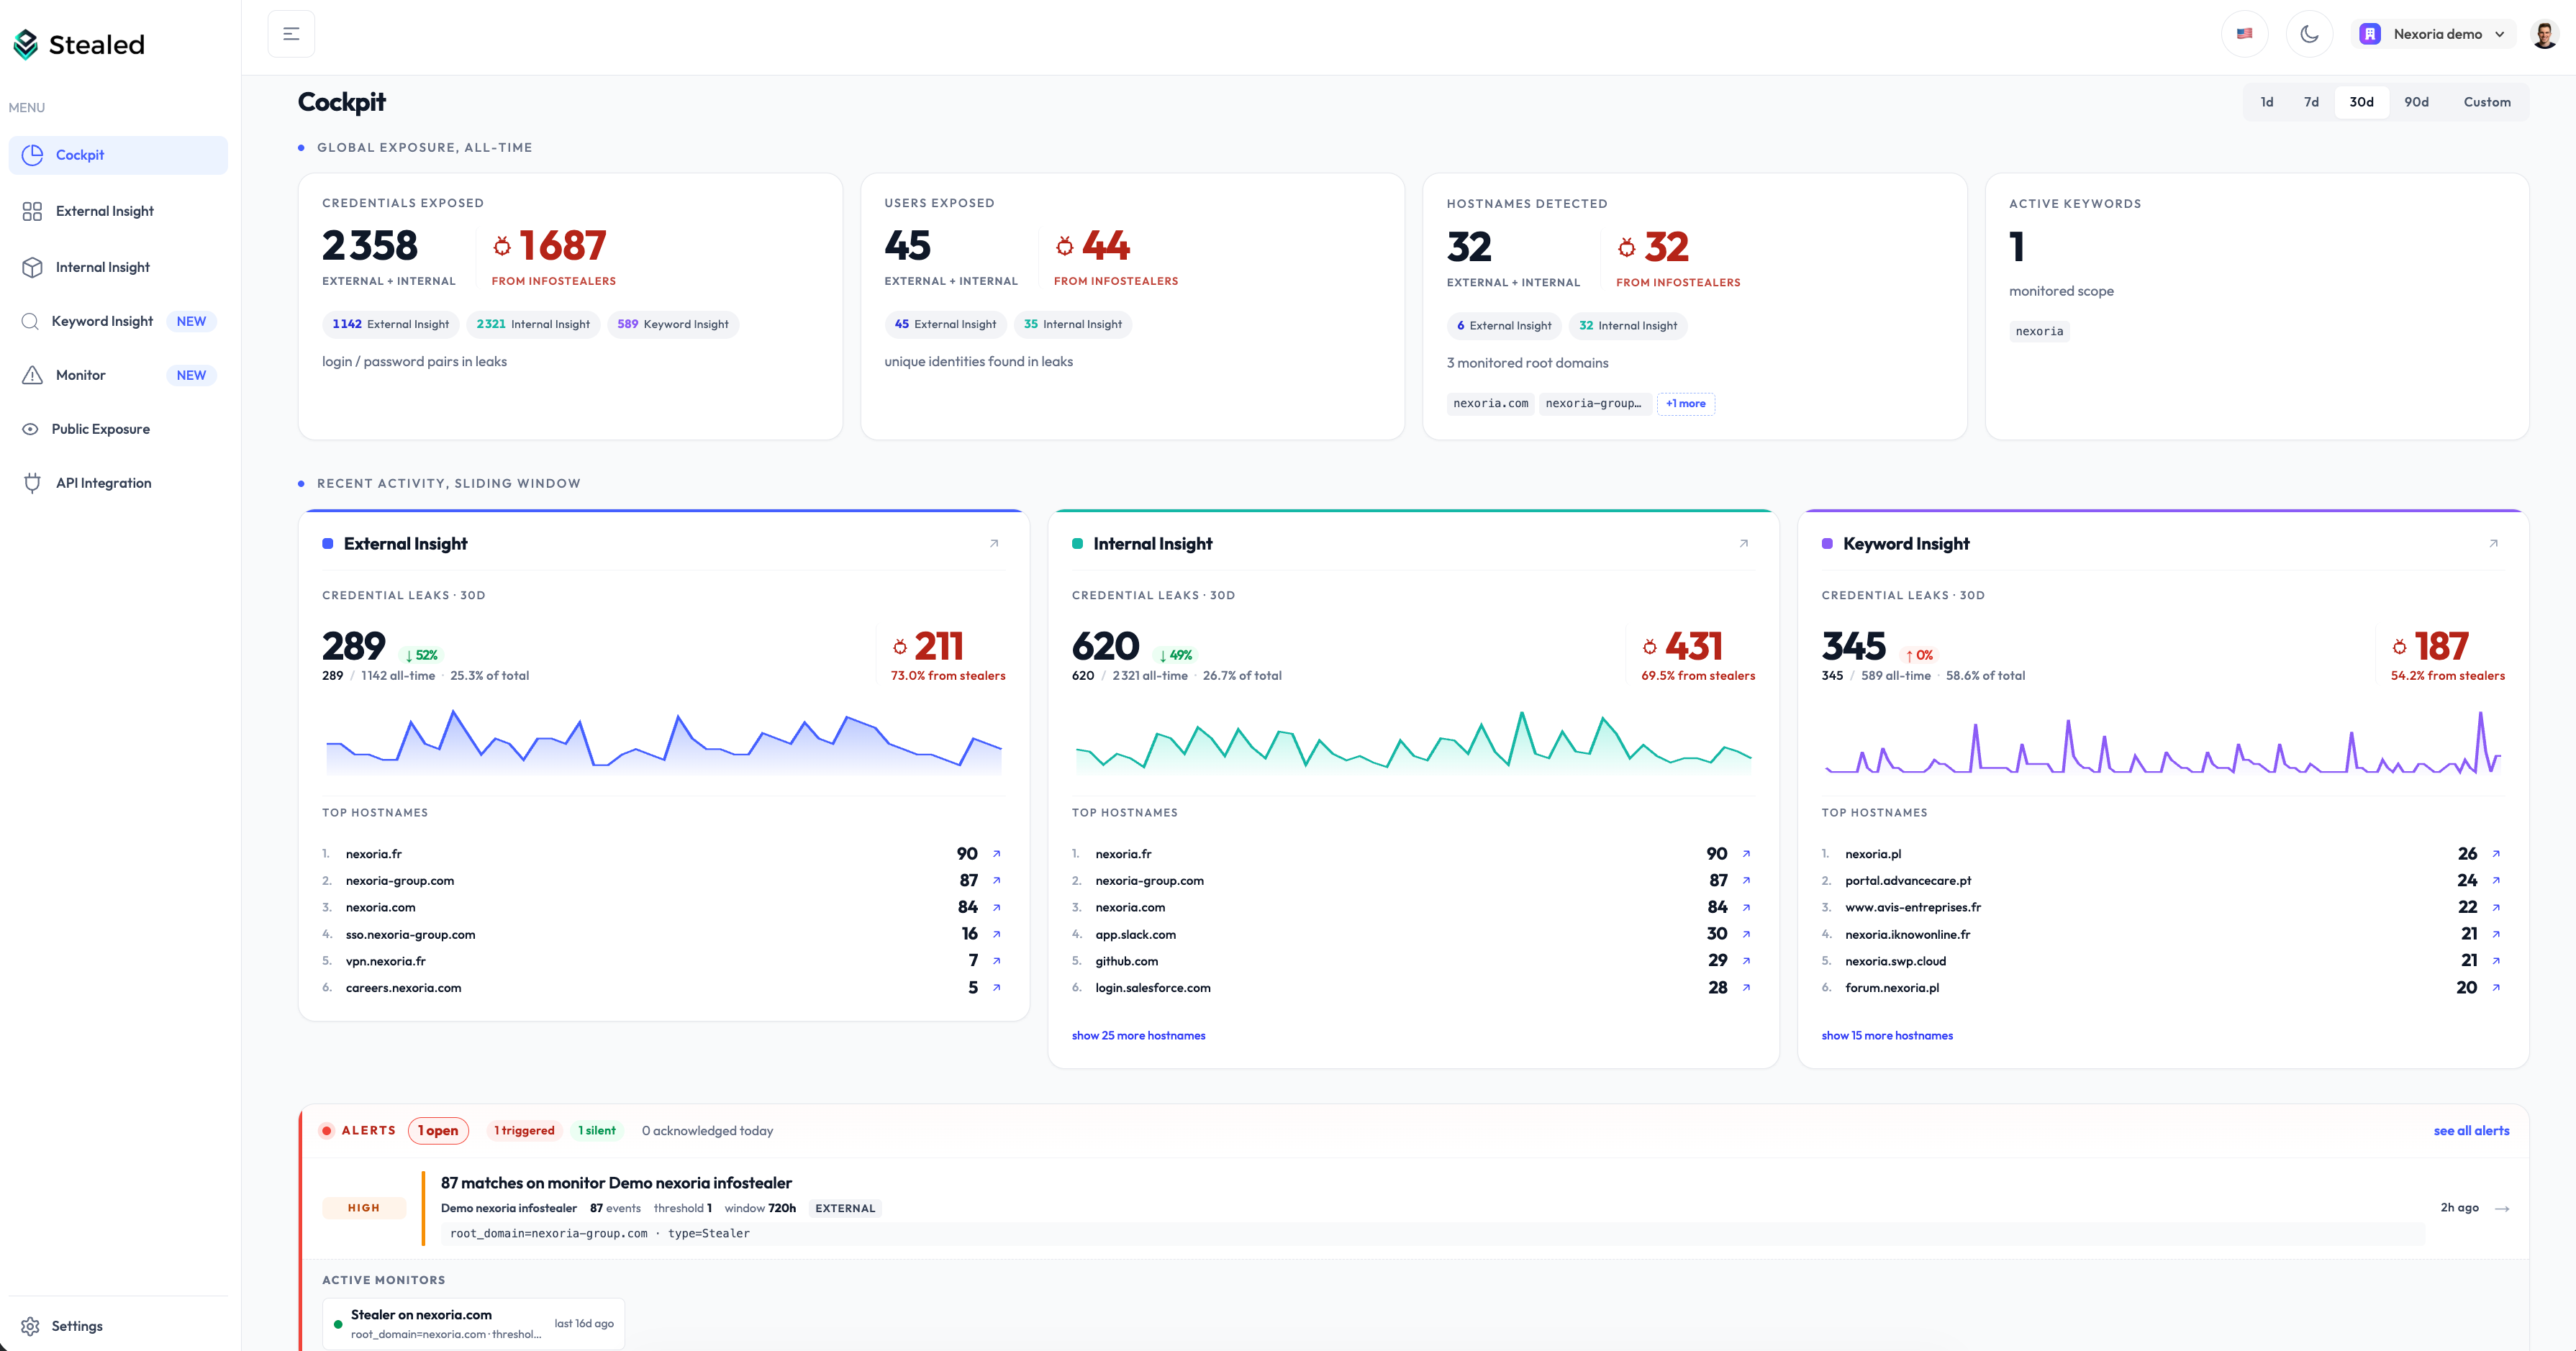
New default landing page. All-time exposure, recent activity per scope, and the state of your monitors, all on one page.

Stealed Cockpit landing page: period selector, Global Exposure KPIs, Recent Activity per scope, Alerts and Active Monitors

The Cockpit is now the page you land on after sign-in. One screen to answer “how exposed are we today, and what changed?” before diving anywhere else.

Three sections stacked top to bottom:

  • Global Exposure, your all-time totals. Credentials, users and hostnames exposed, plus your monitored scope. Each number splits per Insight and isolates the infostealer-sourced leaks at a glance.
  • Recent Activity, what changed in the last 1d, 7d, 30d, 90d or a custom window. One column per Insight, with the trend versus the previous window and the Top hostnames hit during the period.
  • Alerts and Active Monitors, the live state of your monitoring. Triggered events, volumetric anomalies, and a grid of every monitor currently watching.

Every KPI, chip and Top item is clickable: drill straight into the leaks behind a number, or jump to the matching Insight pre-filtered. No more digging through three pages to figure out where the heat is.

Open the app, you are on it.

New

Monitoring is live: the full alerting stack in one module

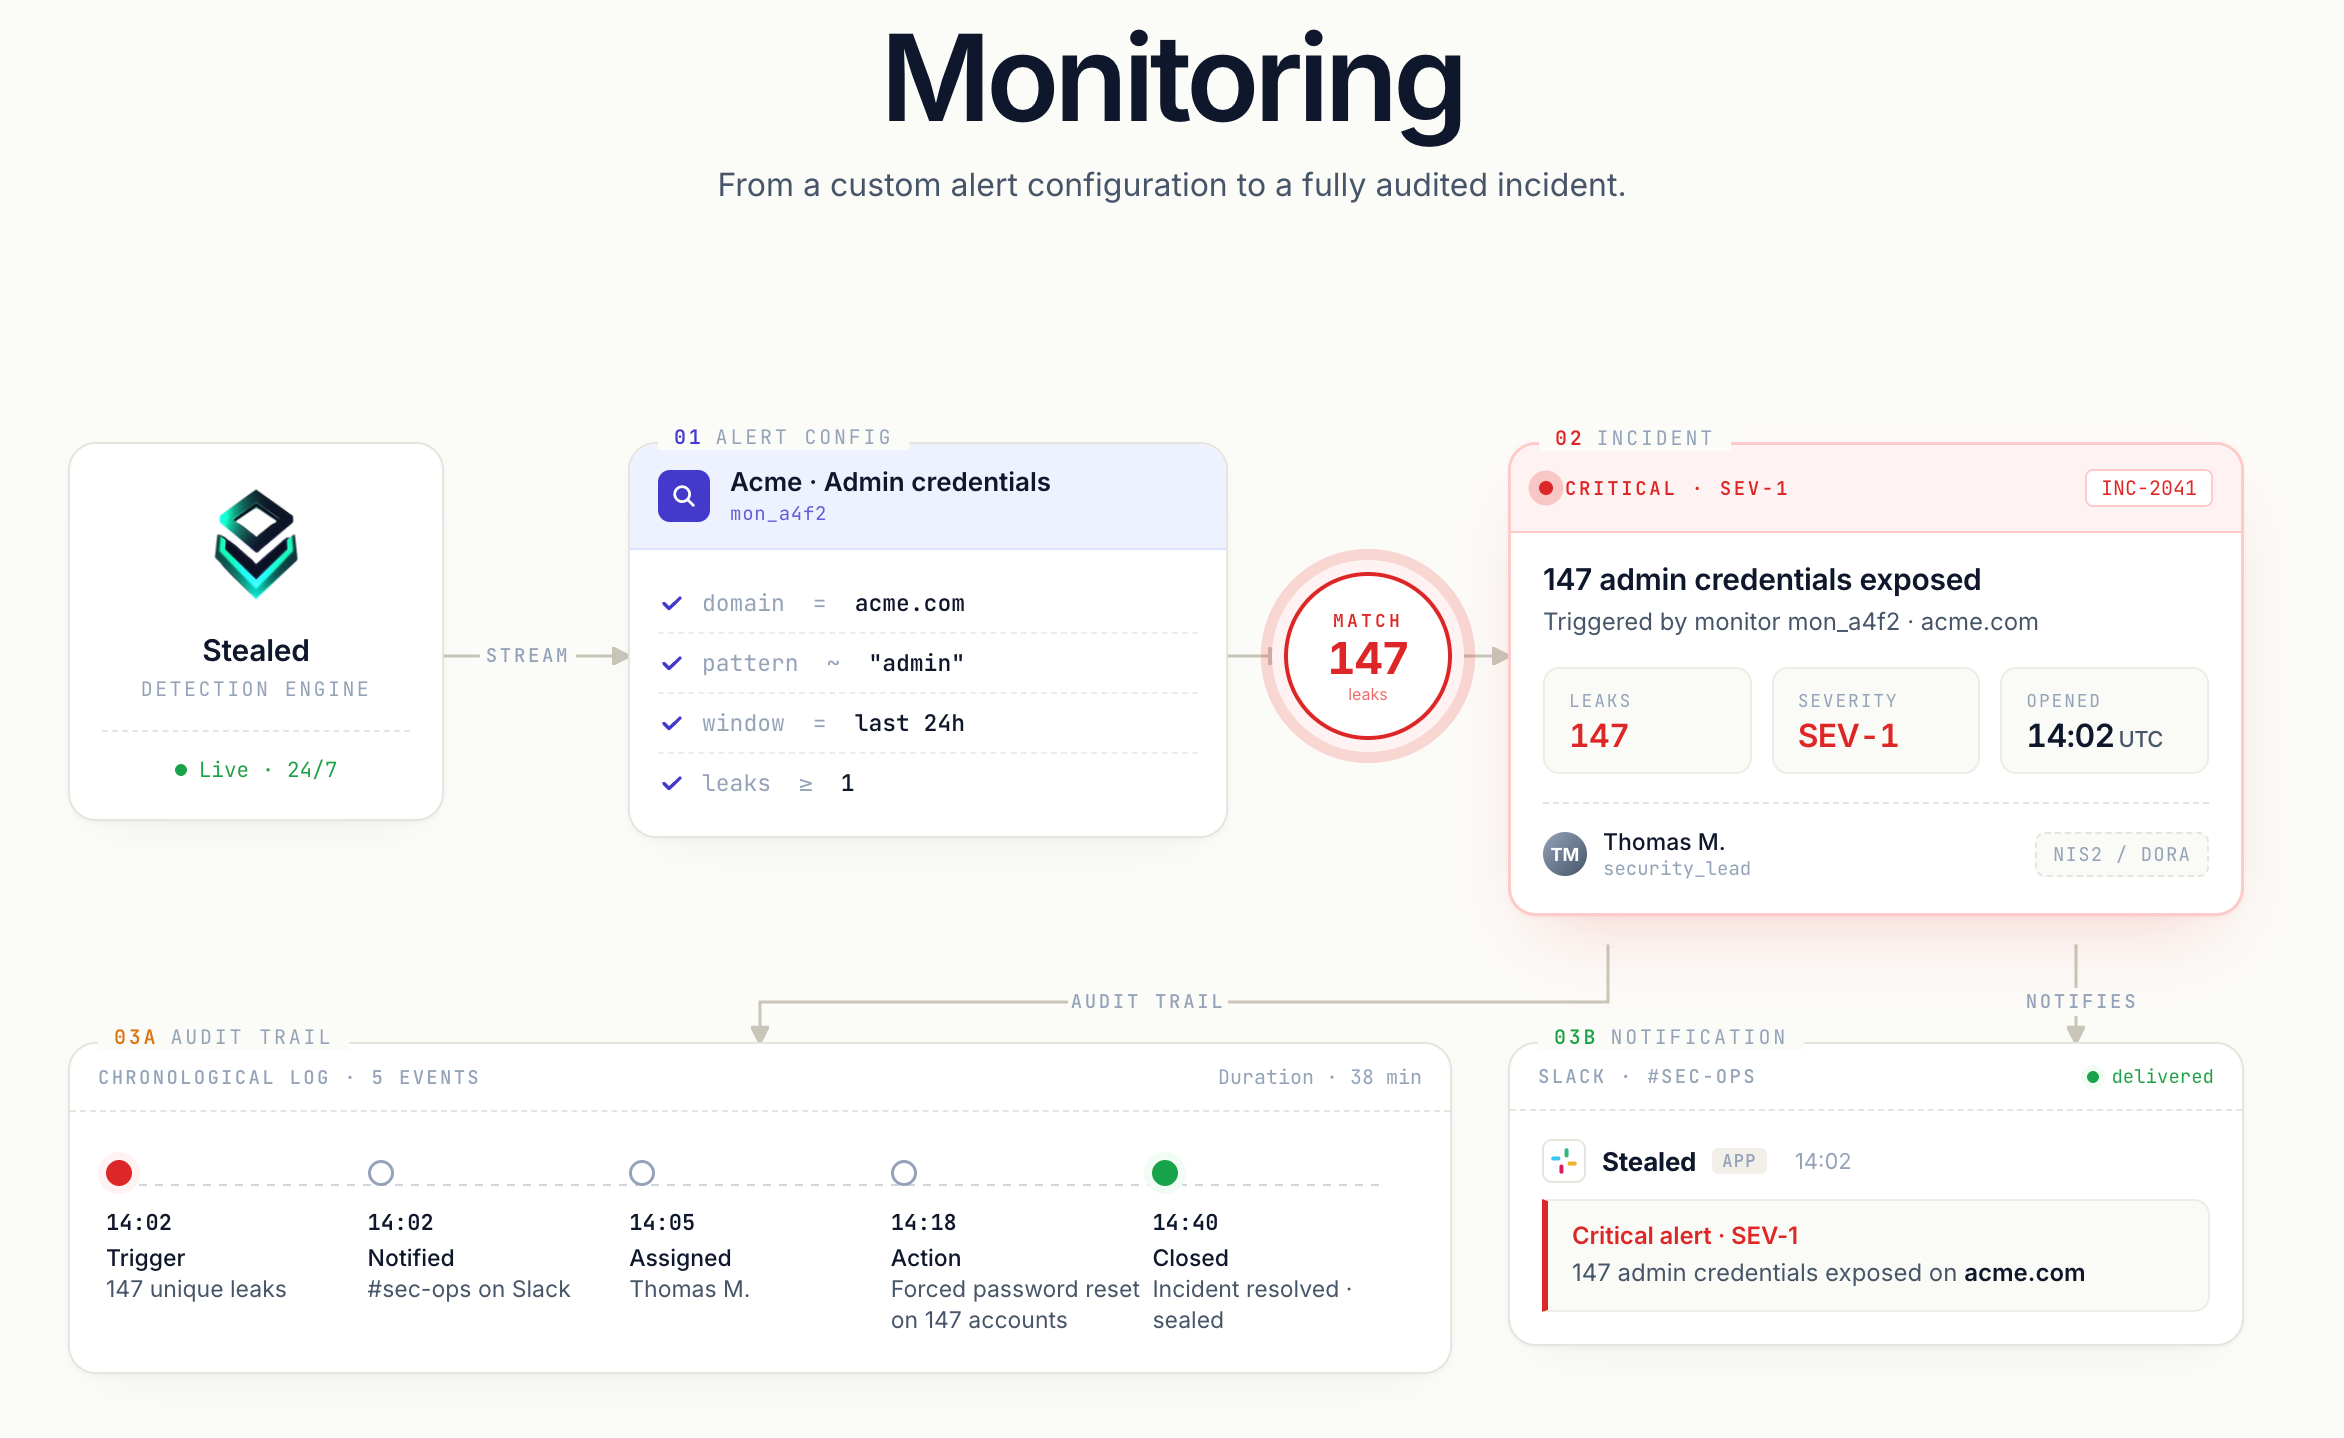
Pattern matching, multi-channel notifications, alert handling system with deduplication, collaborative incident handling, audit trail.

Stealed Monitoring pipeline: from the detection engine to a fully audited incident, through match, notification and chronological audit trail

The Monitoring module is now available. You configure what Stealed watches, where you want to be alerted, and how to handle each alert once it fires.

Pattern matching

A monitor is a rule applied to the live leak feed. The scheduler evaluates it every 10 minutes and fires as soon as a new leak matches.

What you configure:

  • Filters: root domain, subdomain, keyword, leak type (combo list / infostealer), source.
  • Trigger threshold: number of matching leaks before firing.
  • Time-based renotification: reminder every 24 h by default.
  • Volume-based renotification: reminder as soon as N new matching leaks have arrived since the last notification (default: 10), with a 15-minute floor between reminders.
  • Delivery channels: one or more per monitor.

Both renotification mechanisms can coexist on the same monitor: whichever threshold is reached first wins.

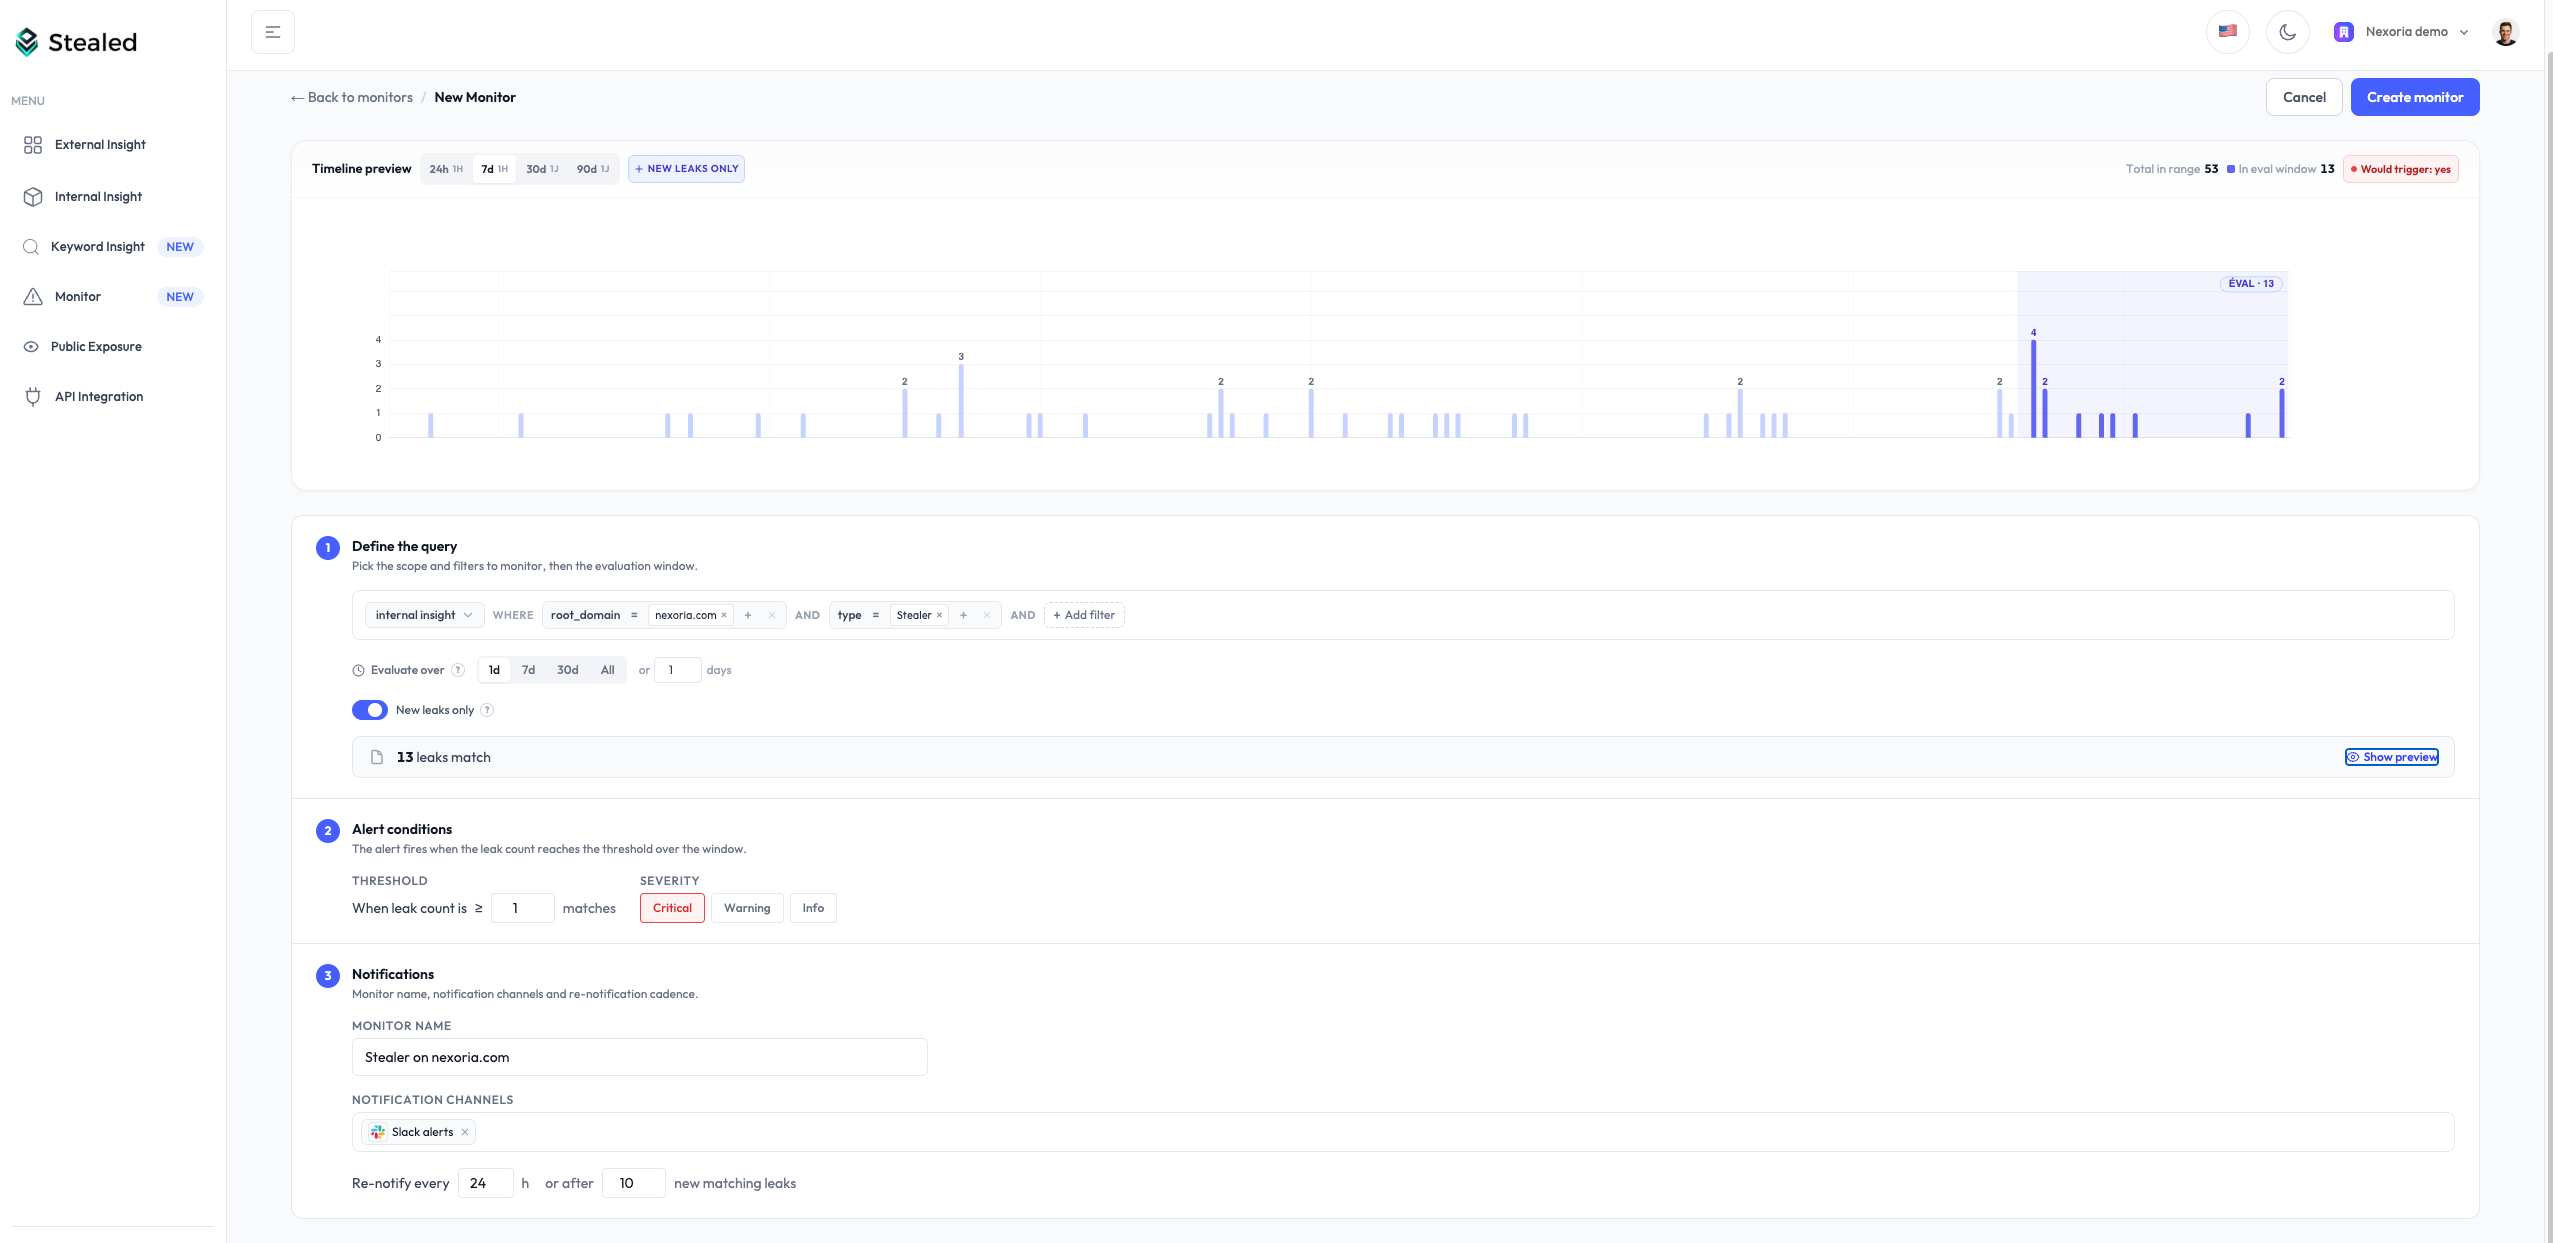
Monitor create form: filters, threshold, renotification and channel selection

During configuration, the count of leaks matching the rule updates live, so you see the monitor’s reach before saving.

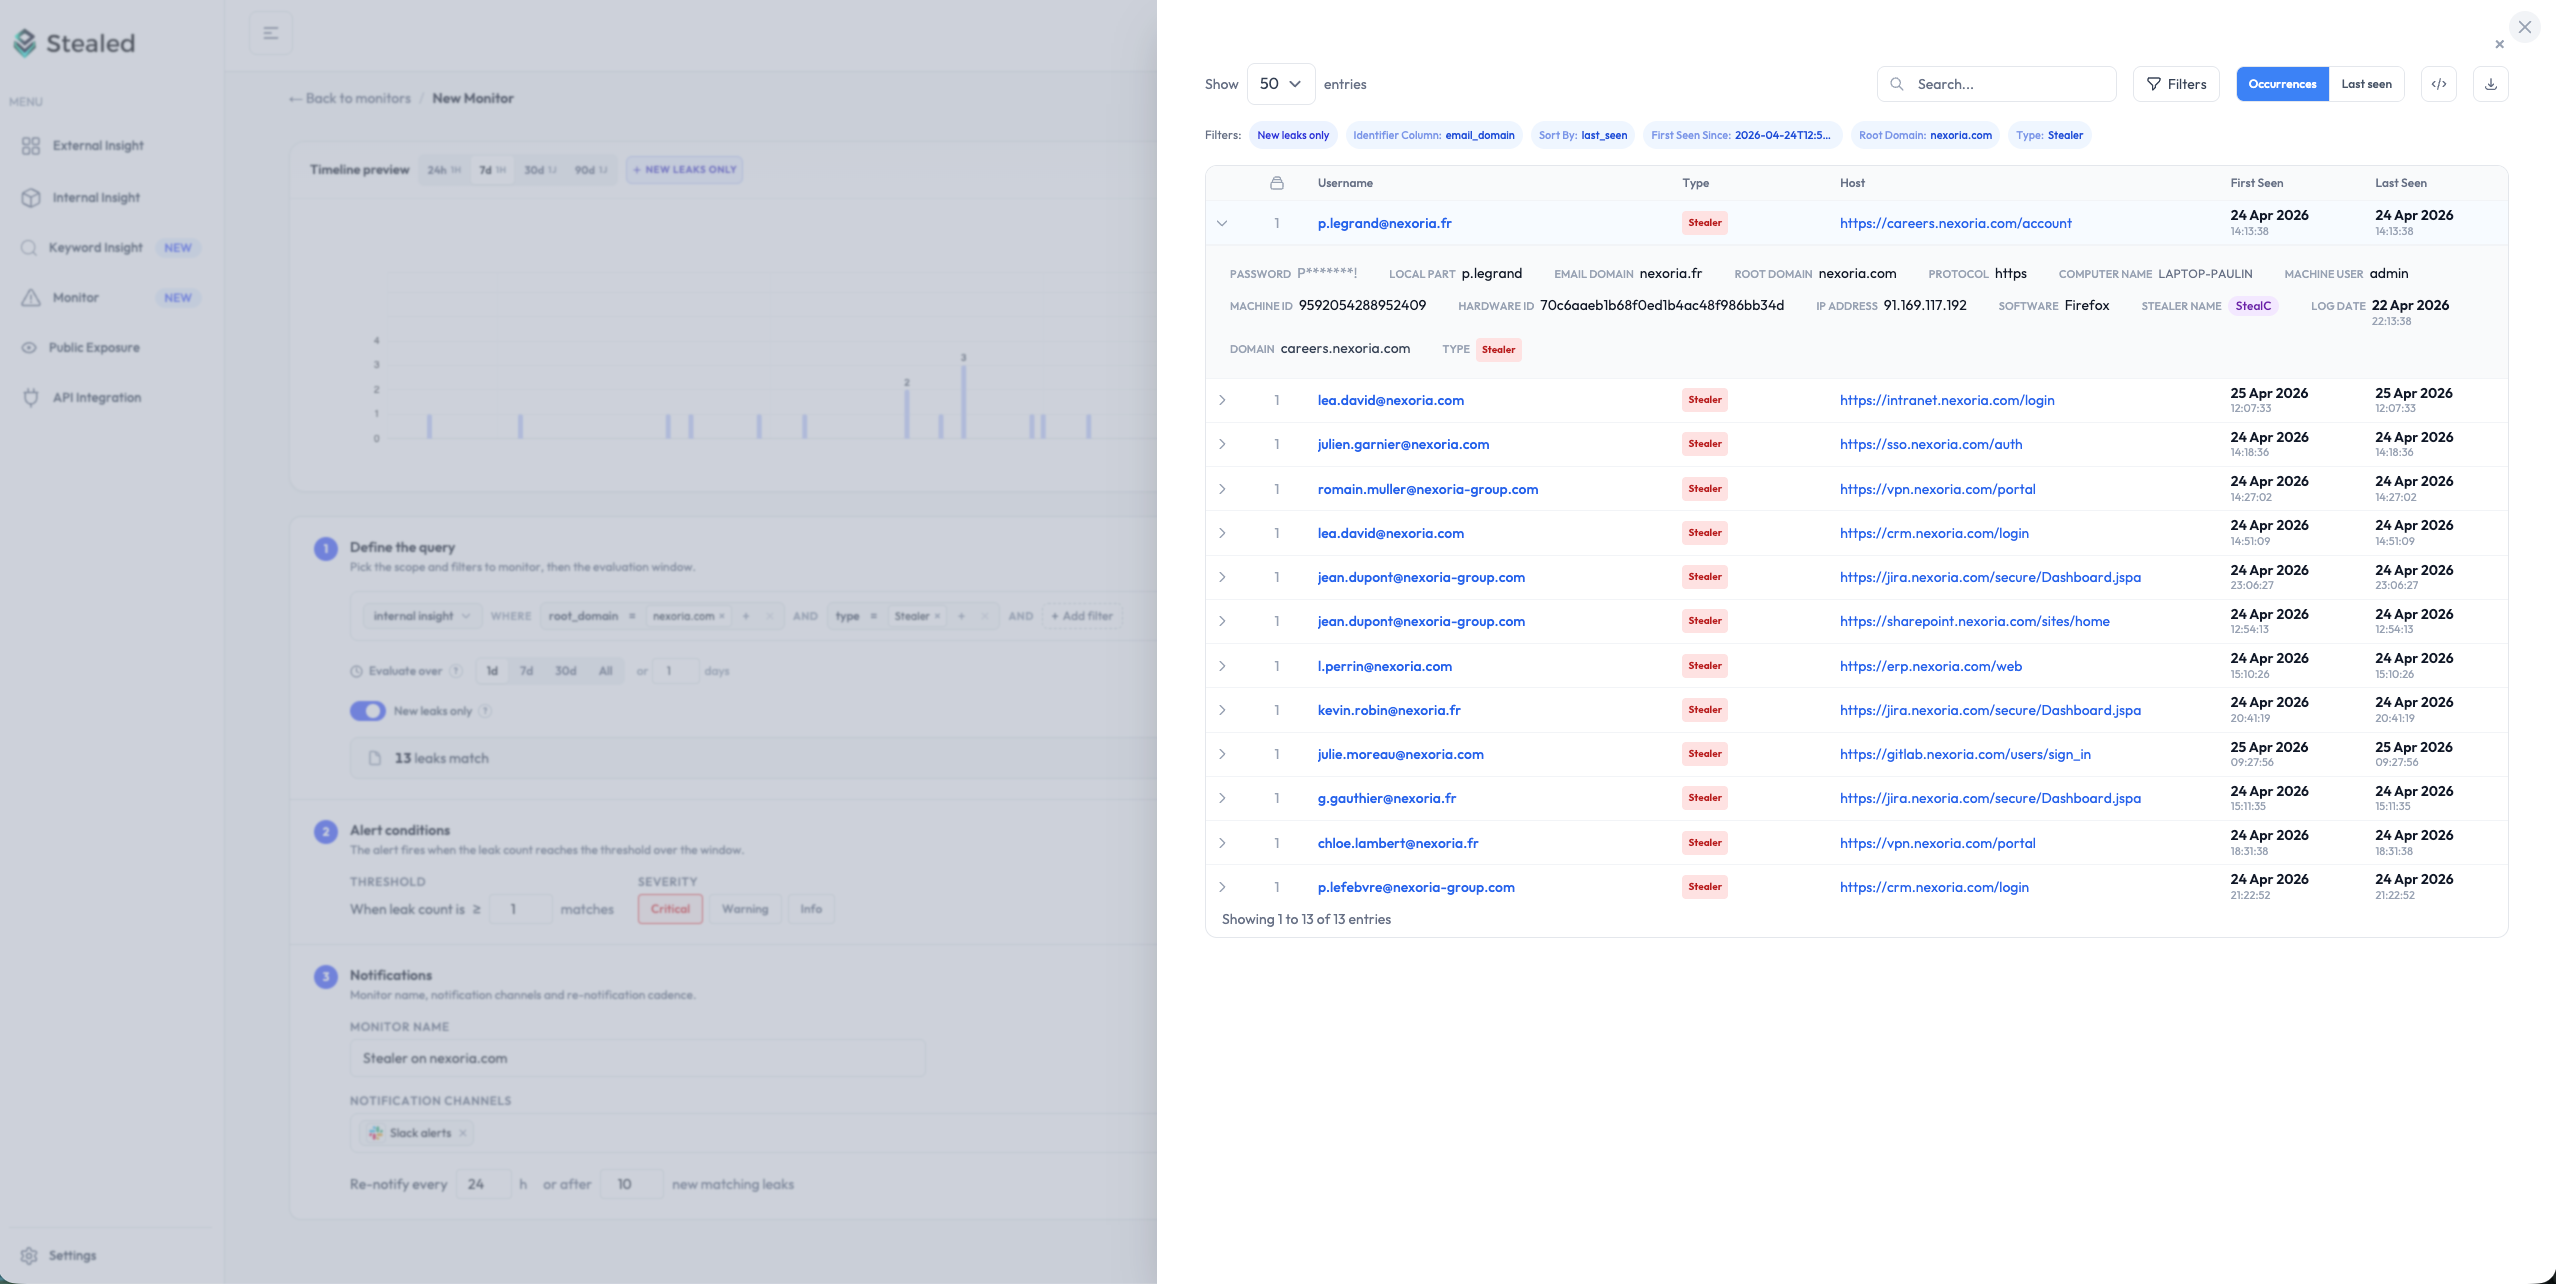
Preview of leaks matching the monitor being configured, displayed alongside the form

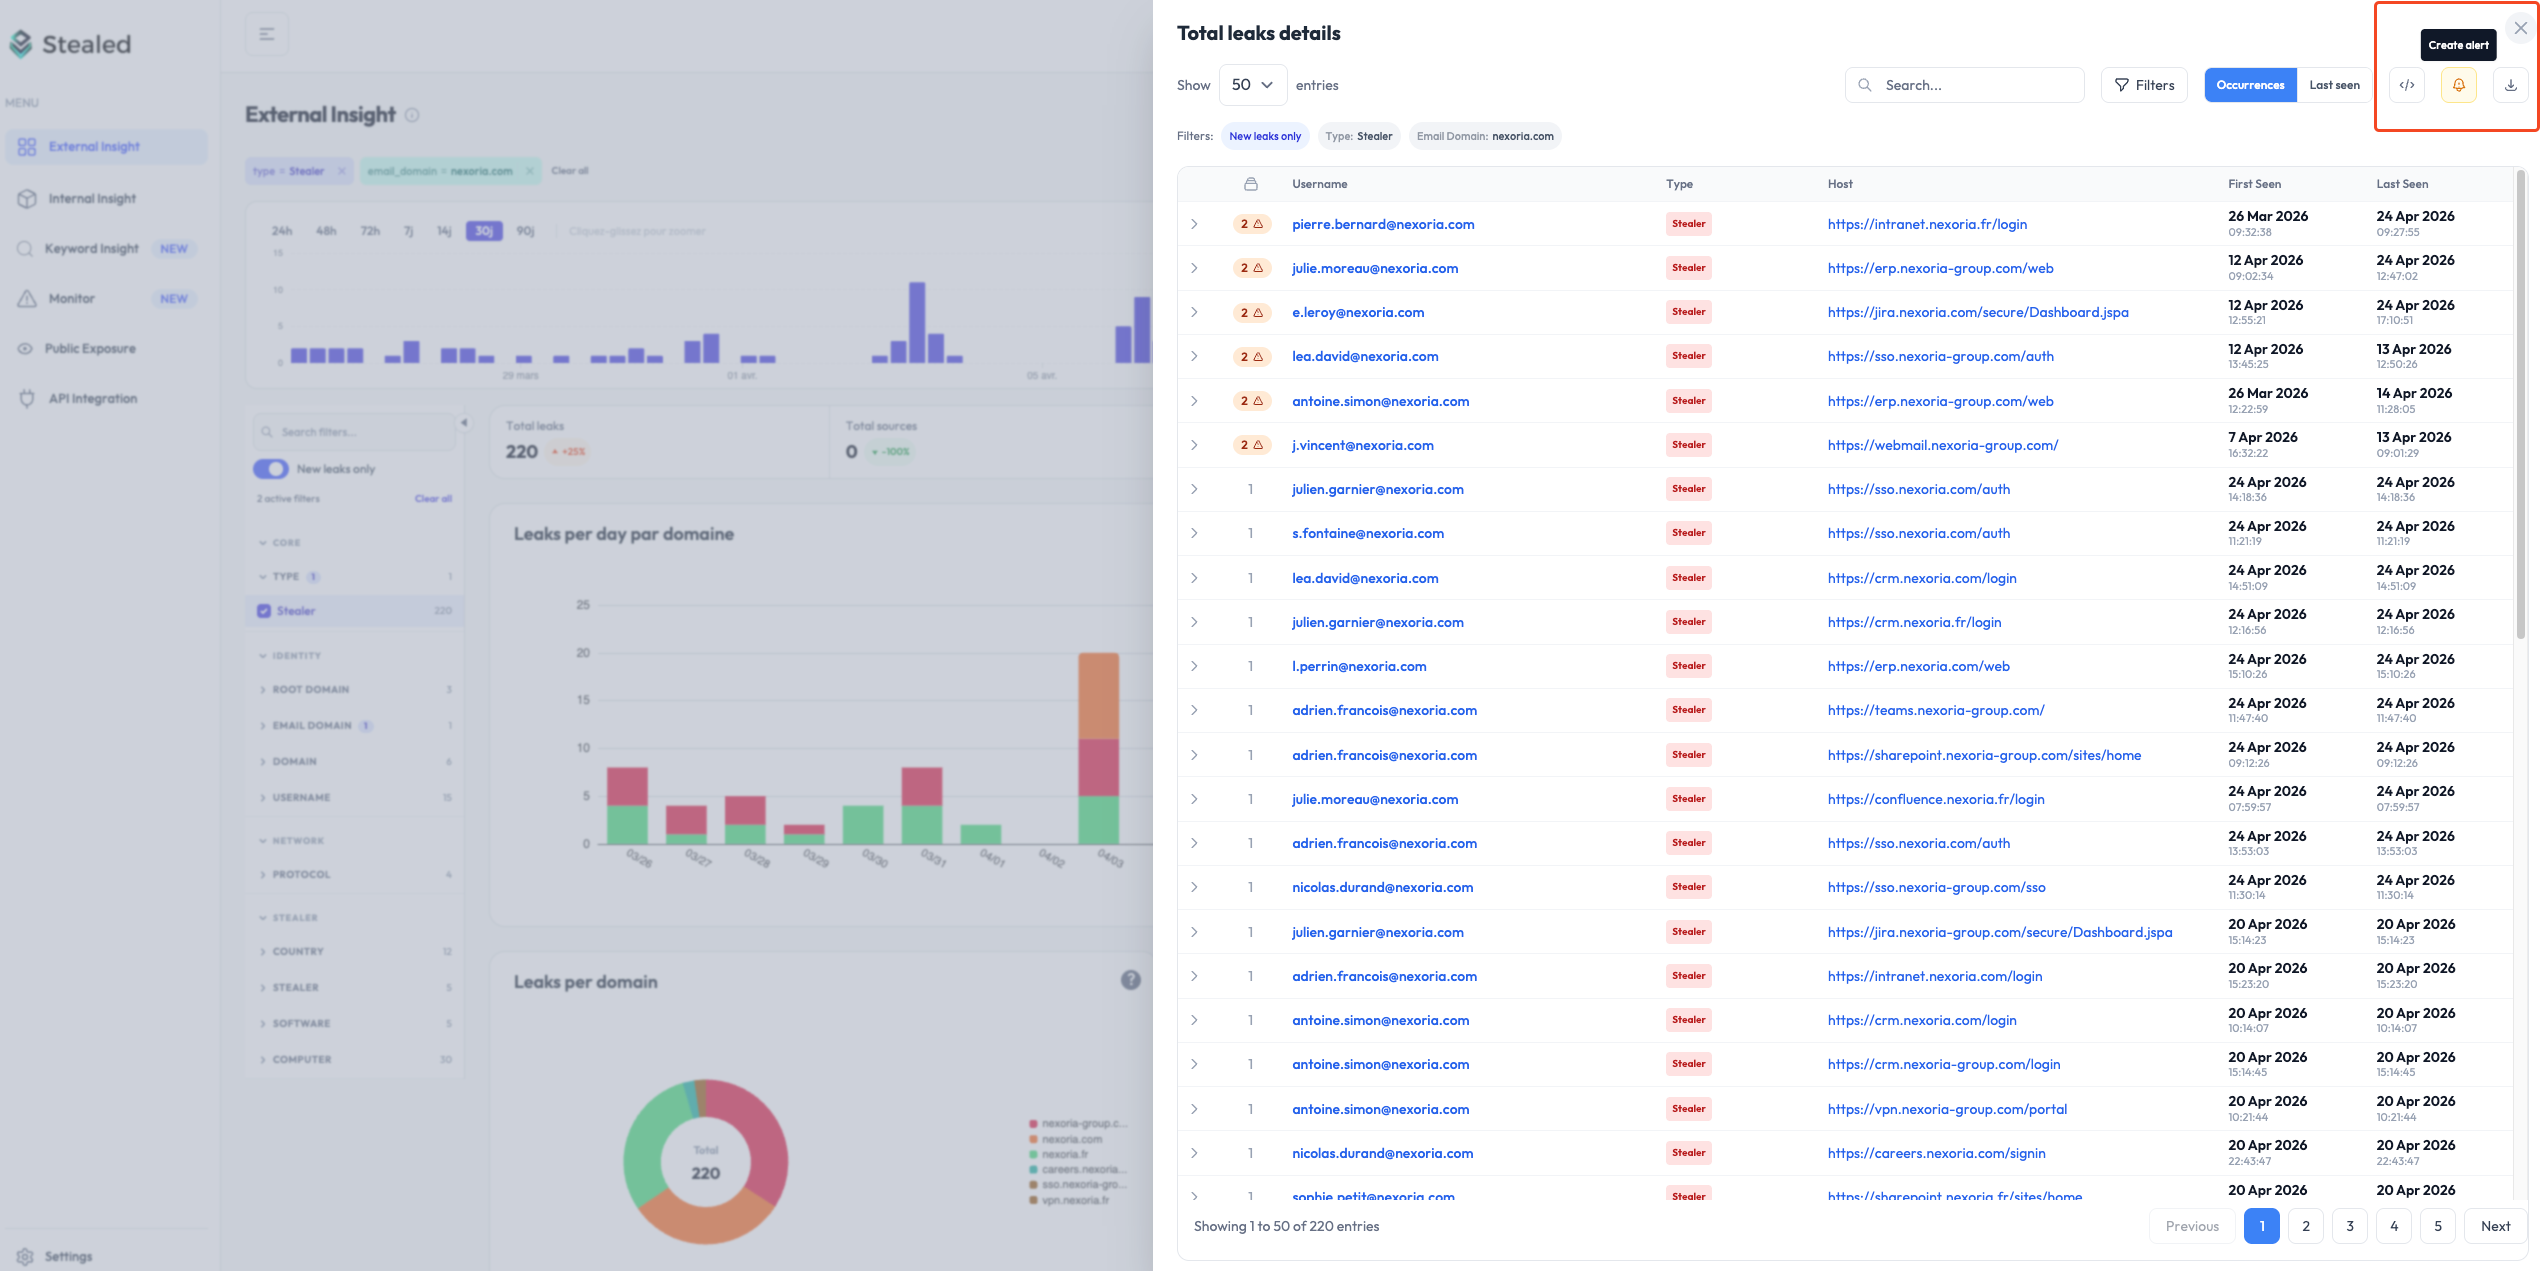
A monitor can also be created directly from an Insight page; filters are prefilled from the displayed context.

Creating a monitor from the External Insight page, with the "Create Alert" button and the matching leaks preview

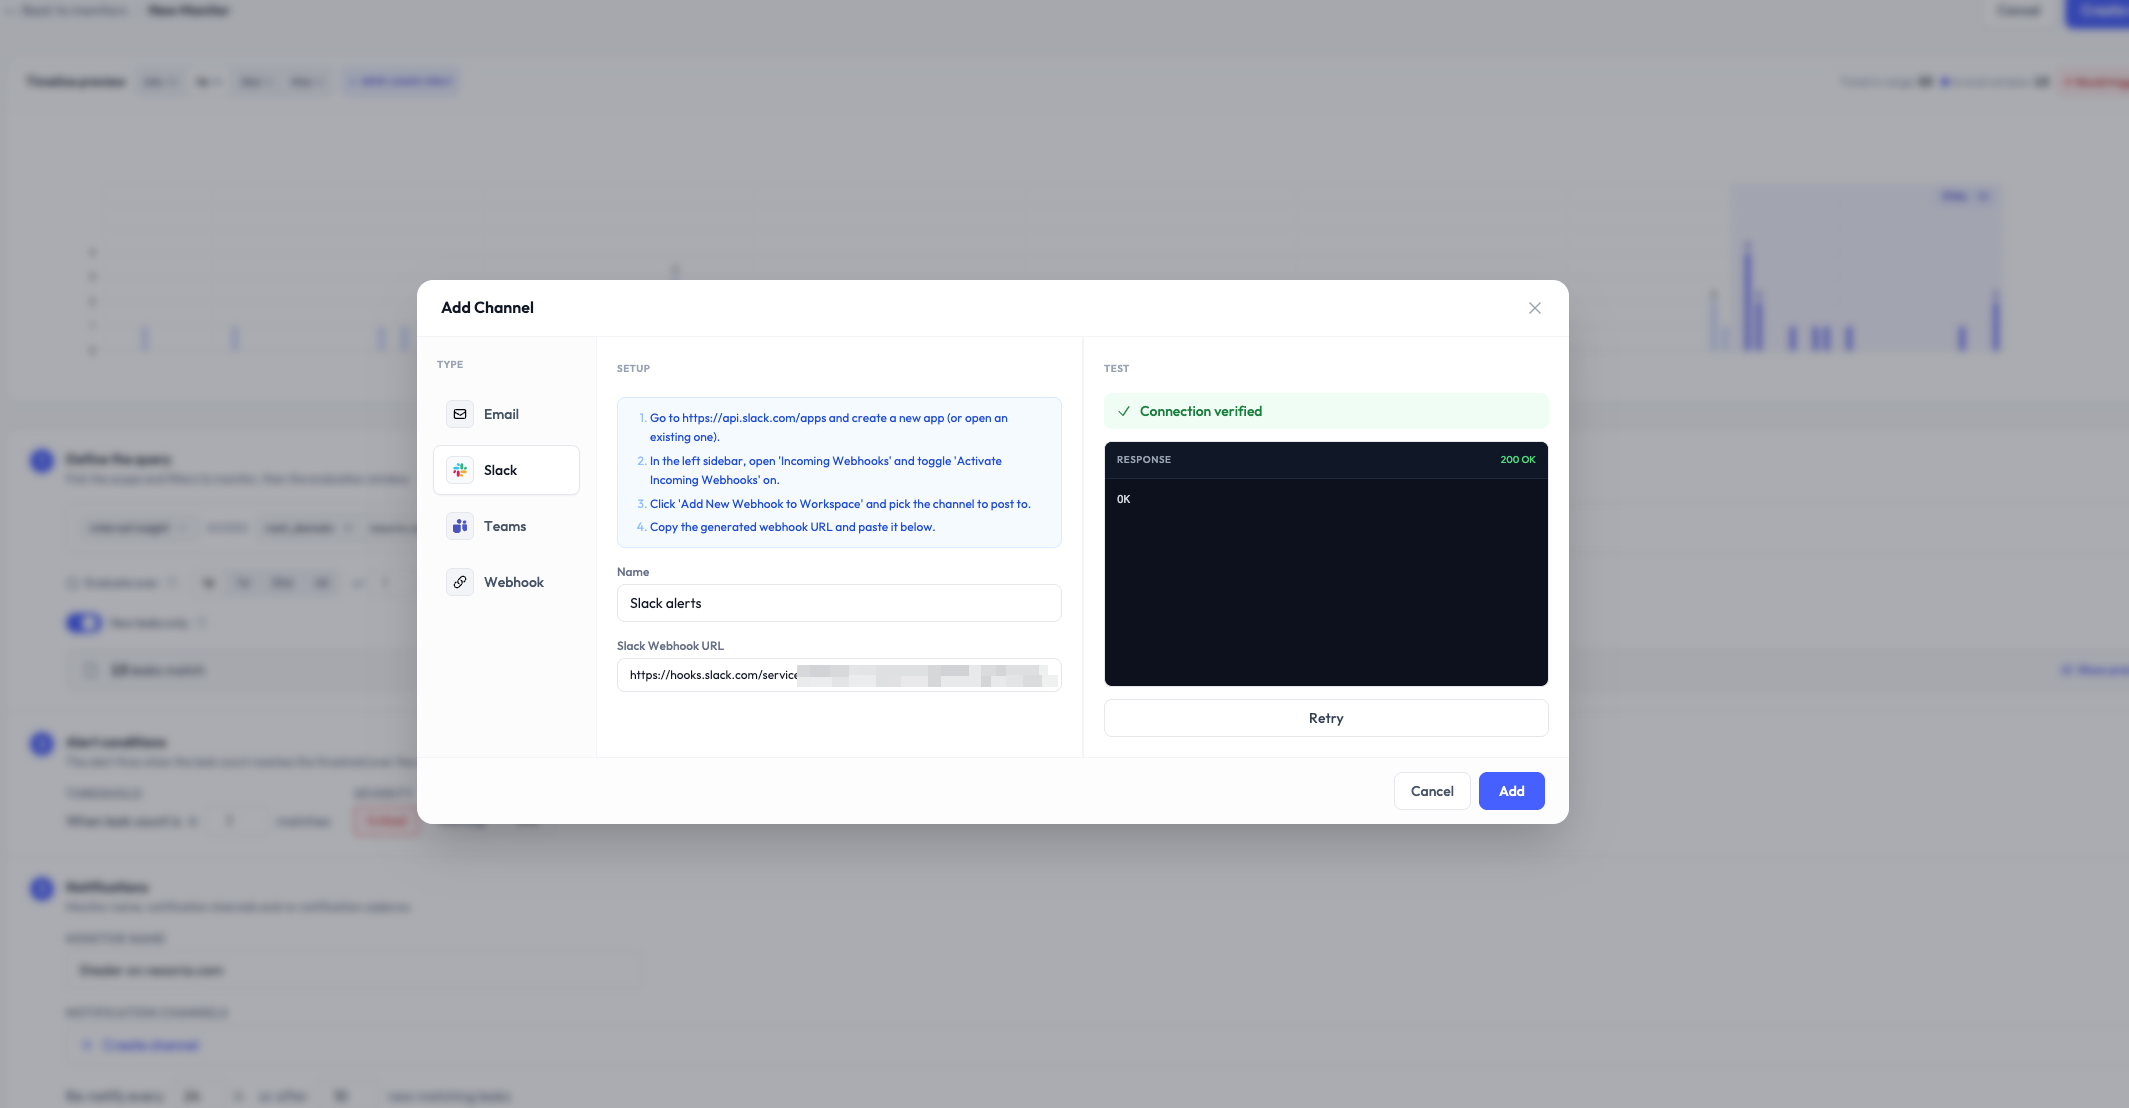
Multi-channel notifications

When a monitor fires, the alert is delivered simultaneously to every channel you’ve configured:

Slack
Microsoft Teams
Webhook
Email

Each channel accepts a Notify on state changes option: every acknowledge, resolve or reopen of an event sends a lightweight notification. Useful to follow team coordination without reopening Stealed.

Notification channel creation: configuration and "state changes" options

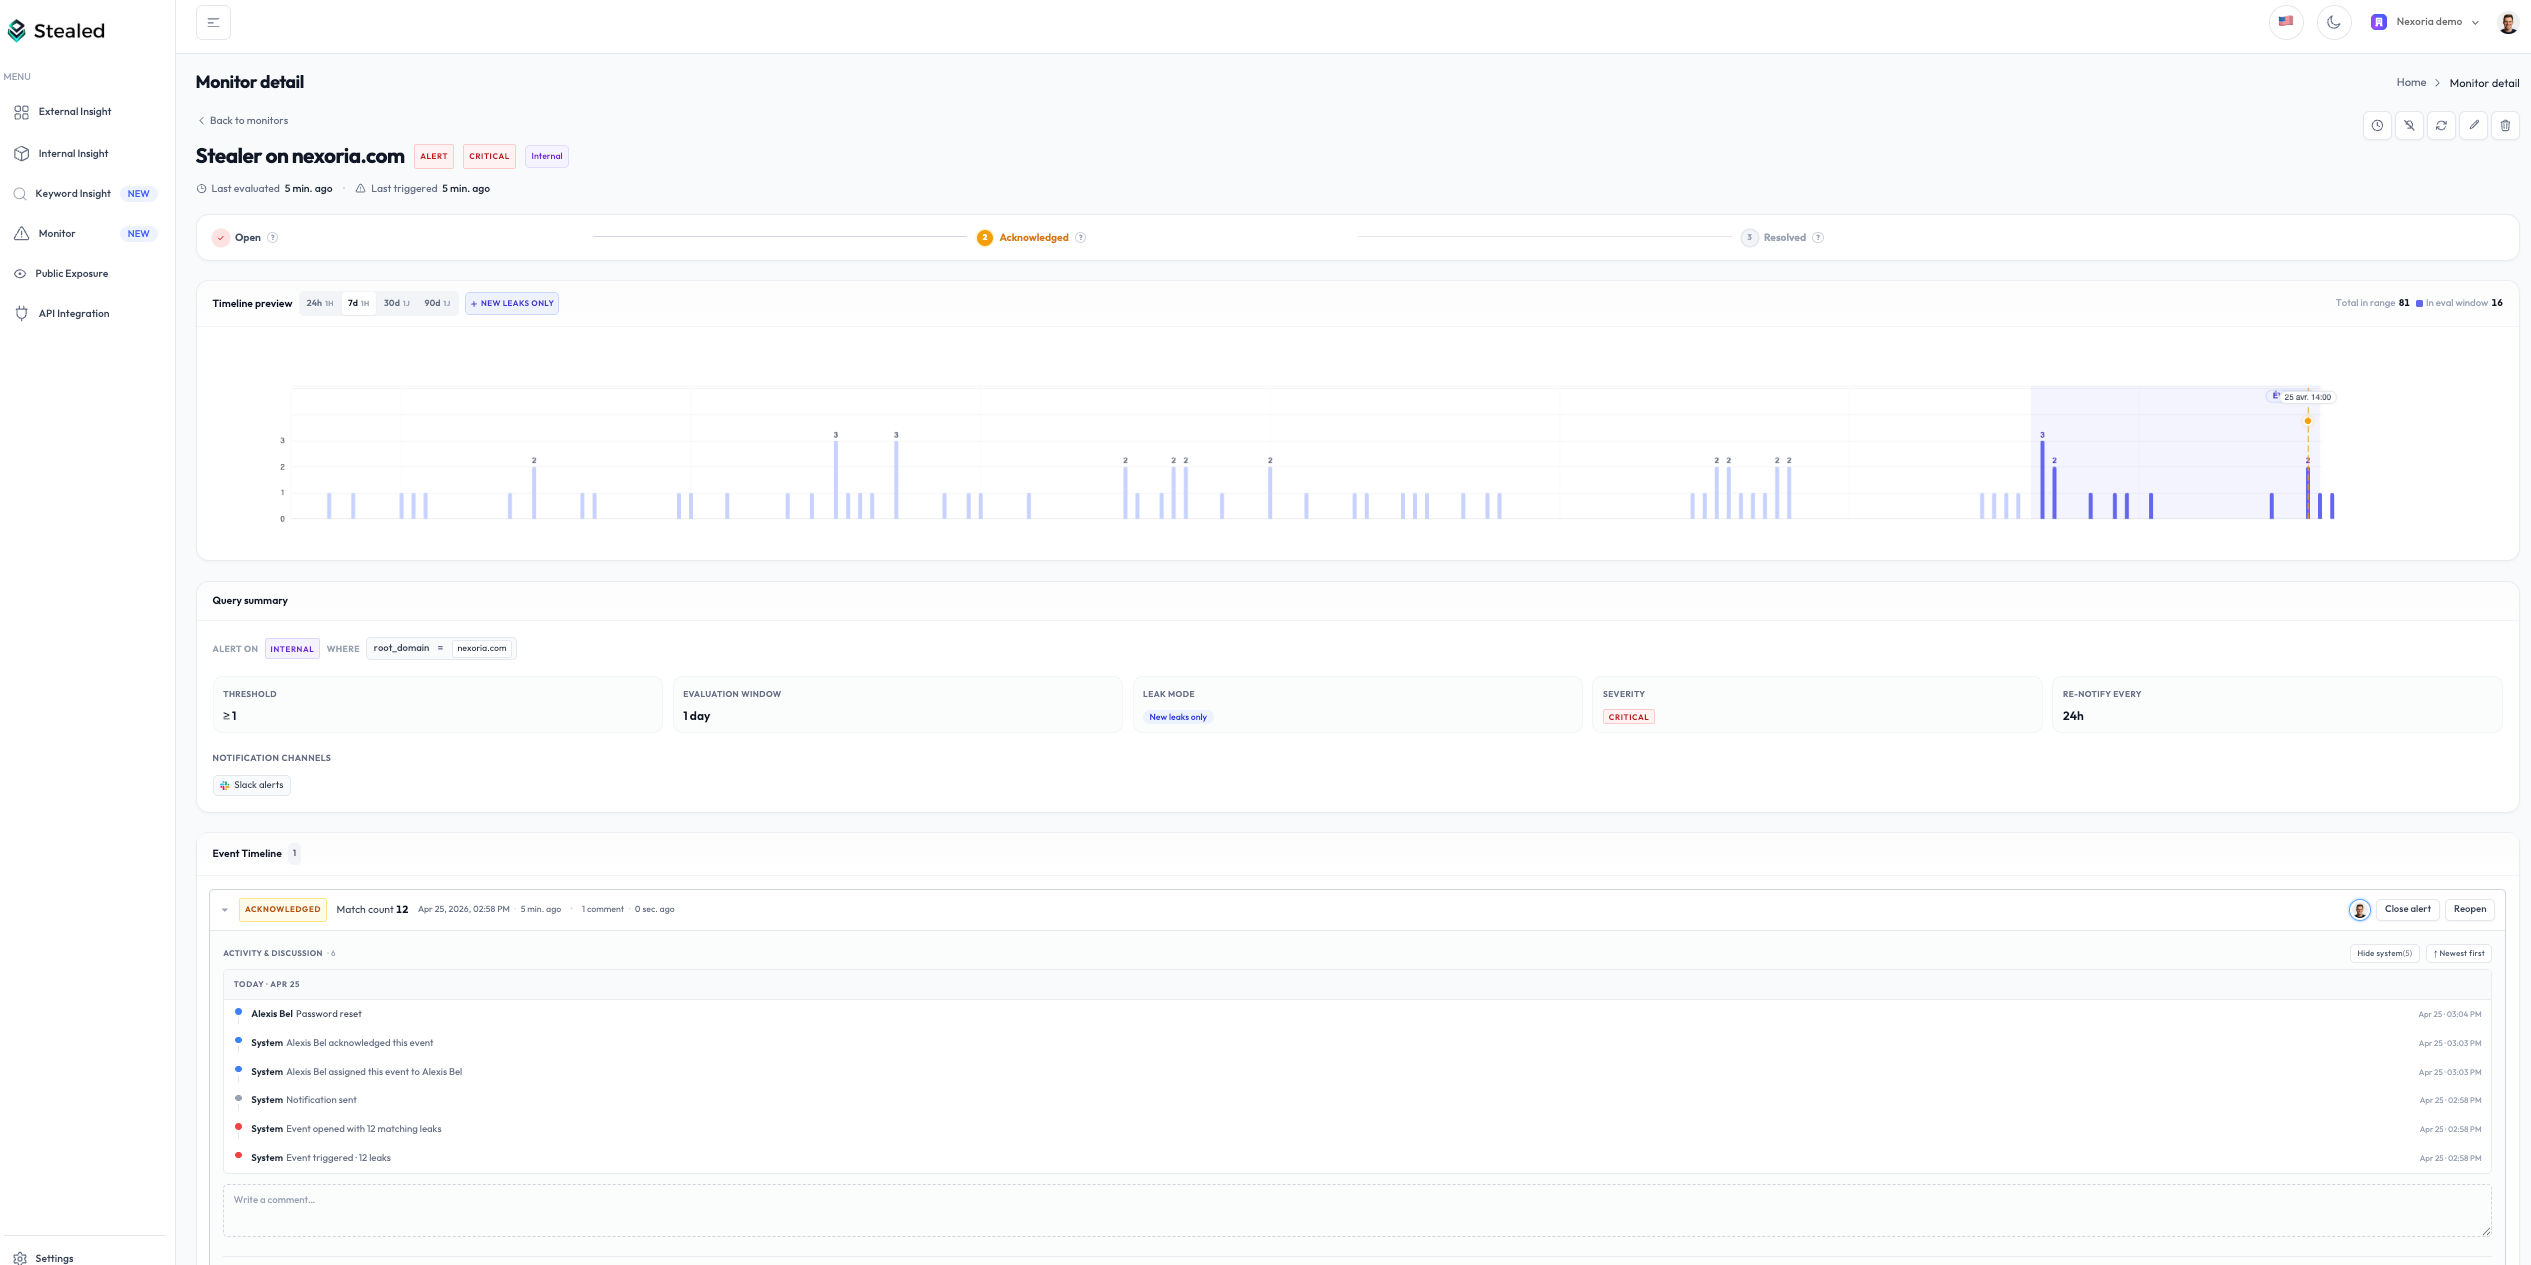
Alert handling system

Every match generates an event your team can act on:

  • Display its context (originating monitor, matching leaks, trigger date).
  • Assign to a team member.
  • Acknowledge: mark as seen / handled.
  • Comment to document a decision or handoff.
  • Mute the underlying monitor (15 min, 1 h, 4 h, 24 h or a custom date).
  • Close once the incident is resolved.

All these actions, along with notifications sent and state transitions, feed the activity timeline of the event. It serves as an audit trail directly usable for NIS2 / DORA.

Alert triggered and event page with available actions (assign, acknowledge, close)

Deduplication

When multiple leaks match the same monitor, Stealed doesn’t open one event per leak:

  • While an event is open, new matching leaks enrich it. The counter goes up, no duplicate is created.
  • Once the event is closed, a new matching leak opens a new event, but only with new hashes: credentials already tracked are not re-counted.

Result: alerts only signal genuinely new leaks, never historical noise.

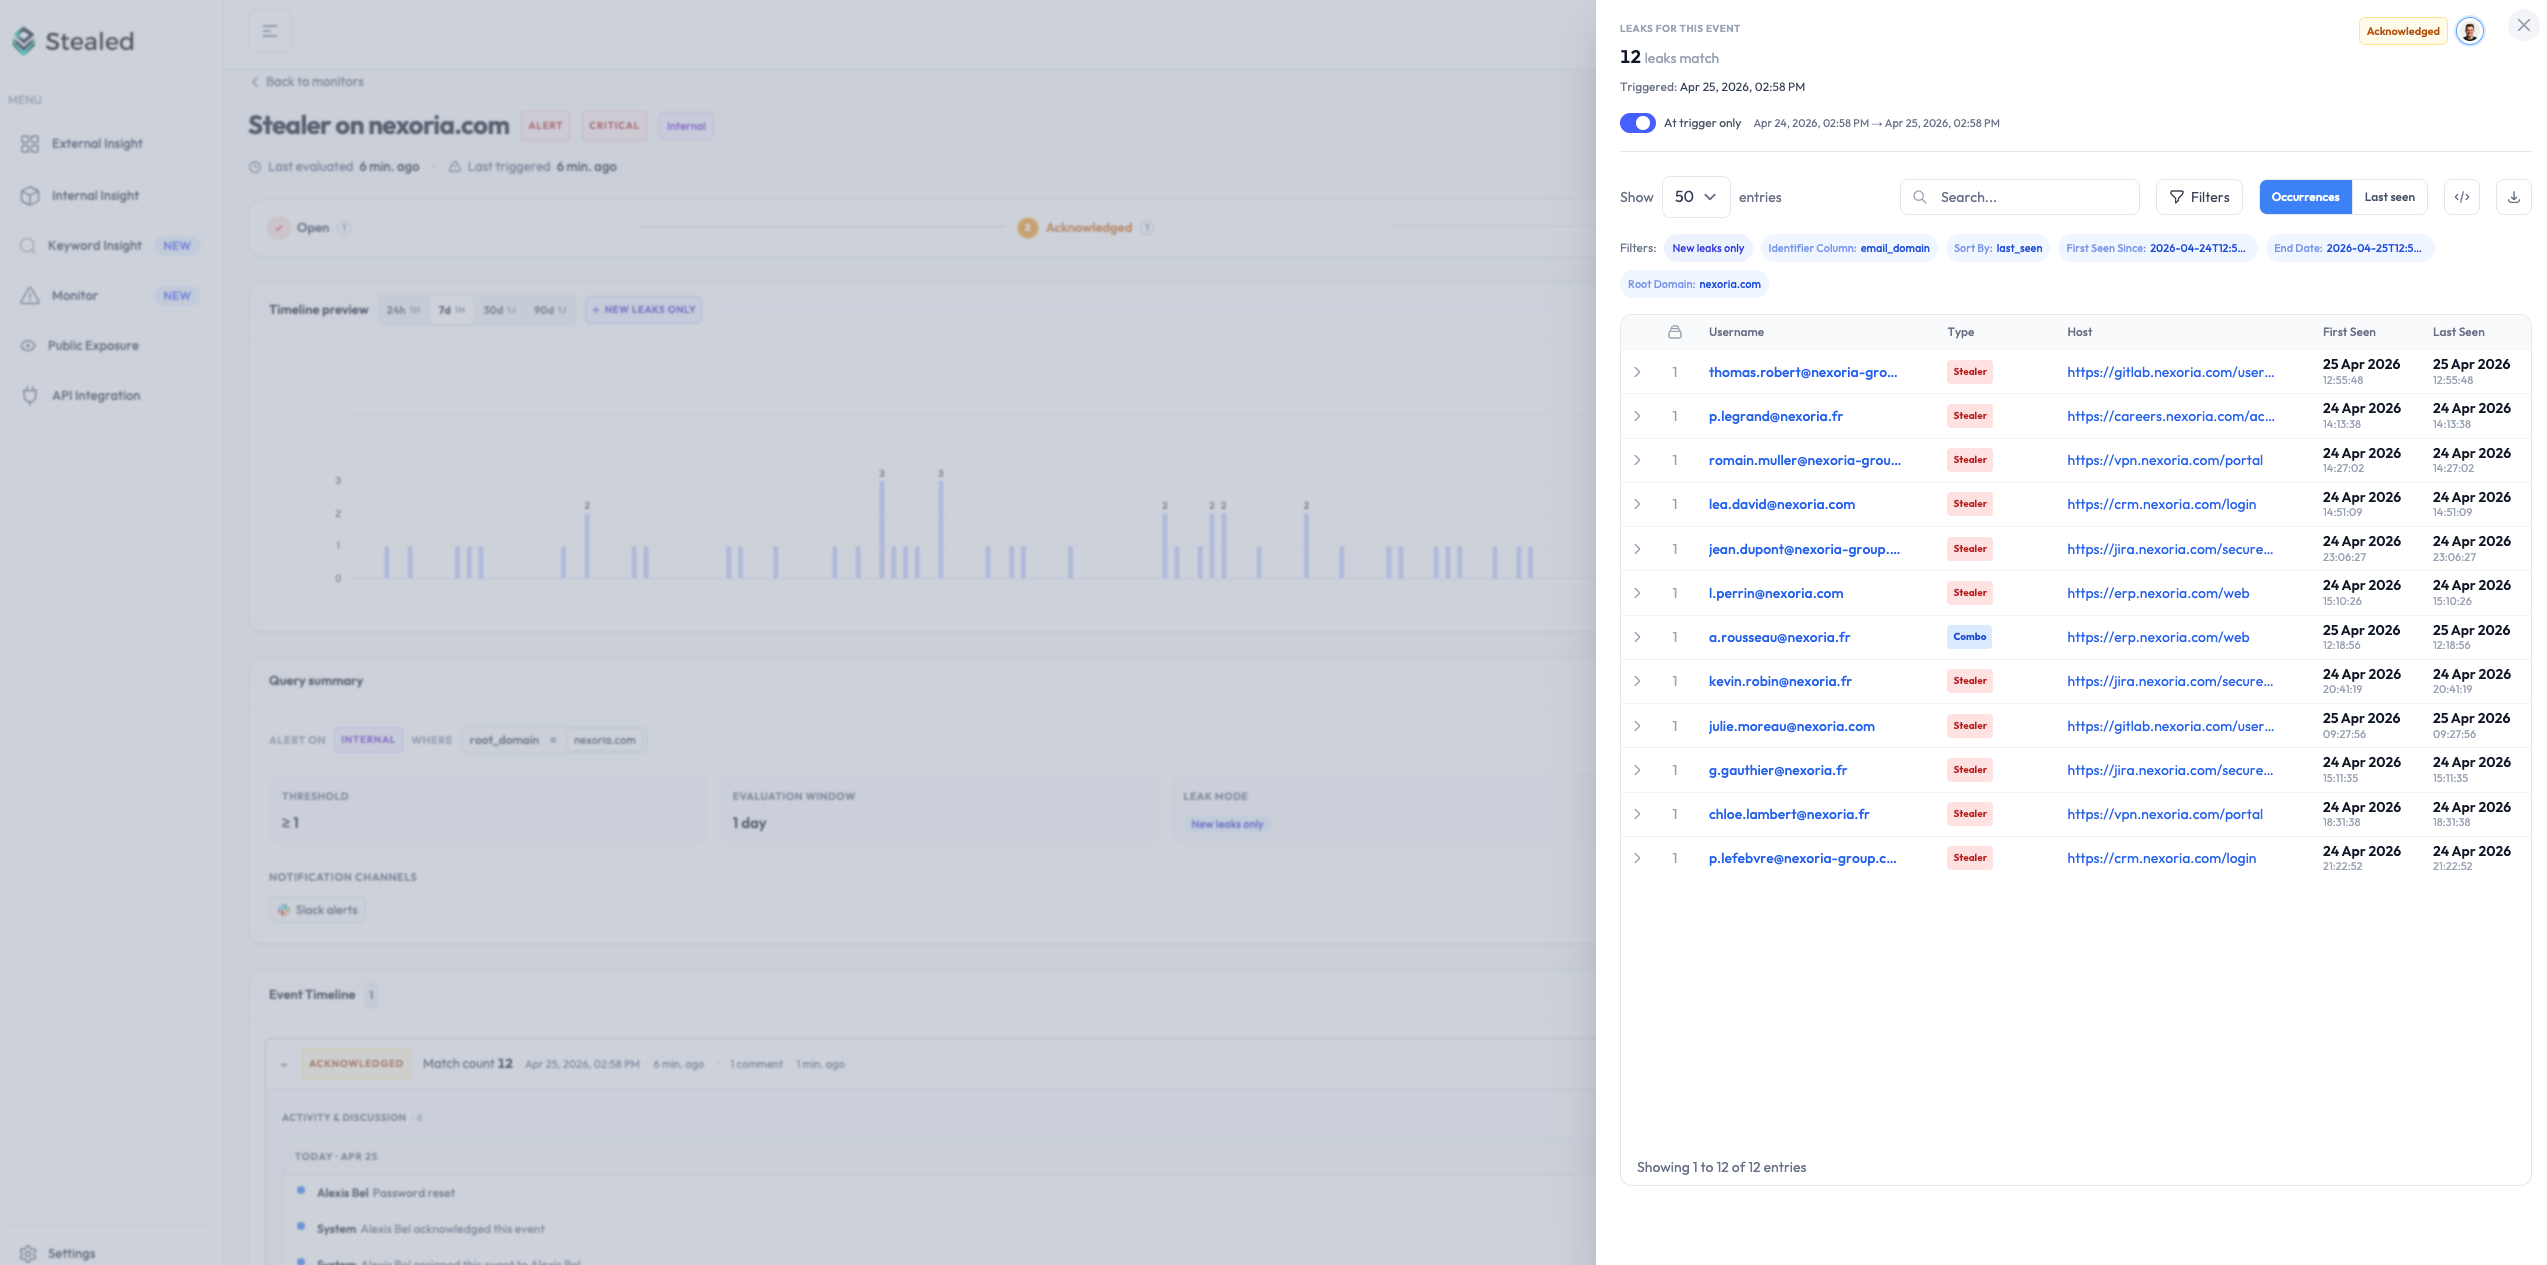
Leak preview

For every event, the detailed list of credentials that triggered the alert can be inspected with two views:

  • At trigger: frozen, leaks that matched at the exact moment of the trigger.
  • Live: leaks that continue to match while the event is open.

Leak preview of a Stealer event with both tabs and the activity timeline

View all monitors

All monitors are available on the Monitoring page, with their status (active, muted, triggered) and the open events counter.

List of active monitors with their status and open events counter

New

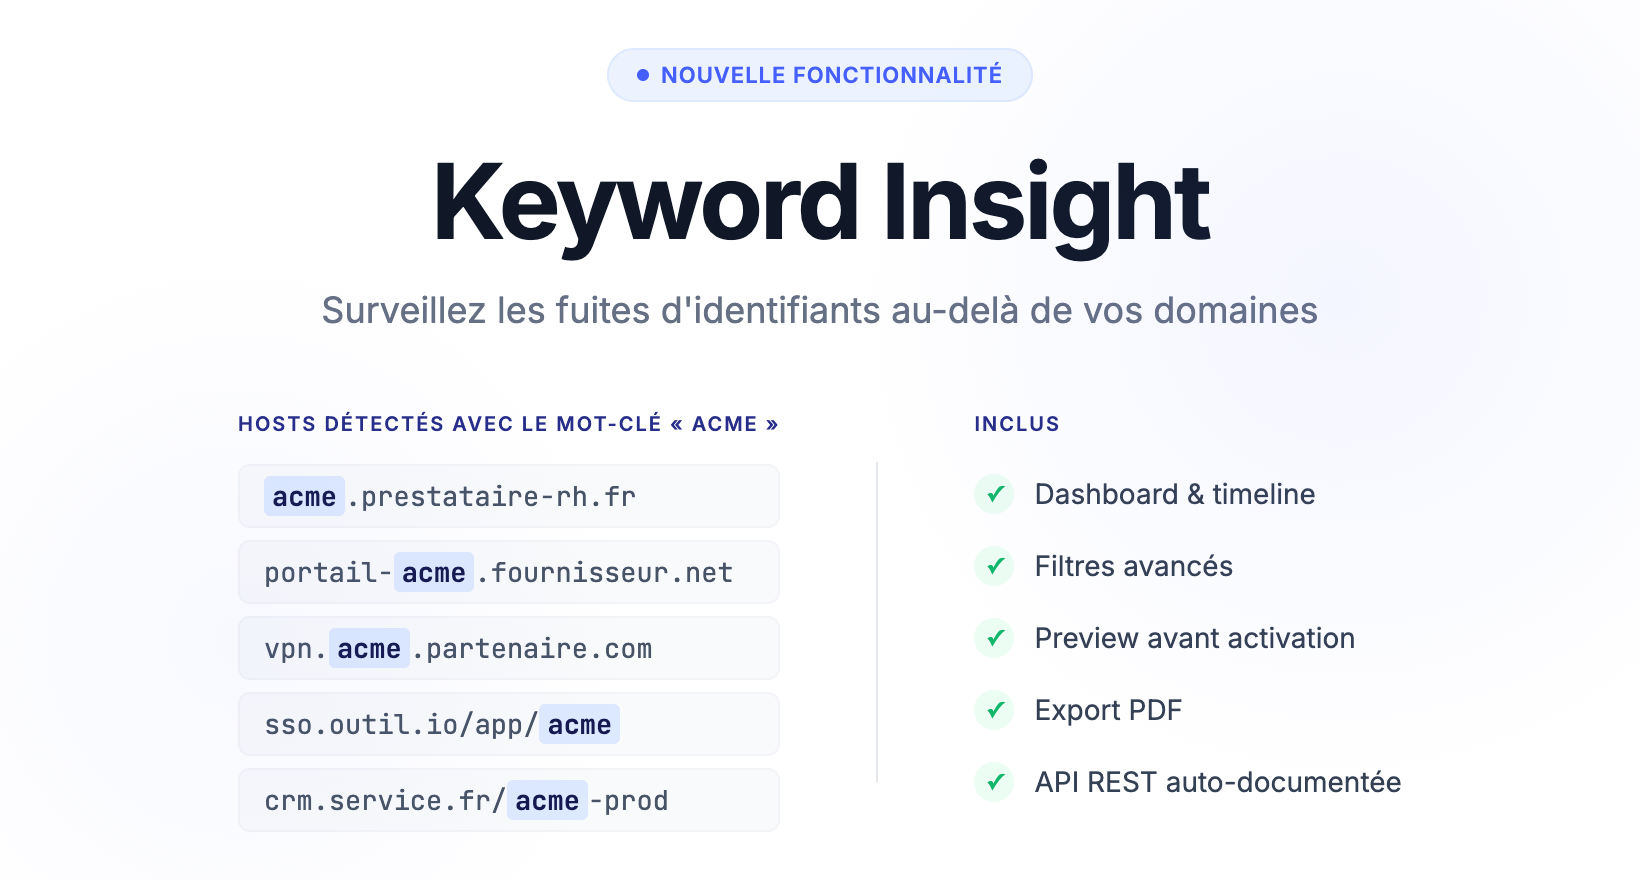
✨ Keyword Insight: Monitor leaks beyond your domains

Detect credential leaks on any URL containing a keyword — including third-party domains, vendor portals, and SaaS platforms you don't own.

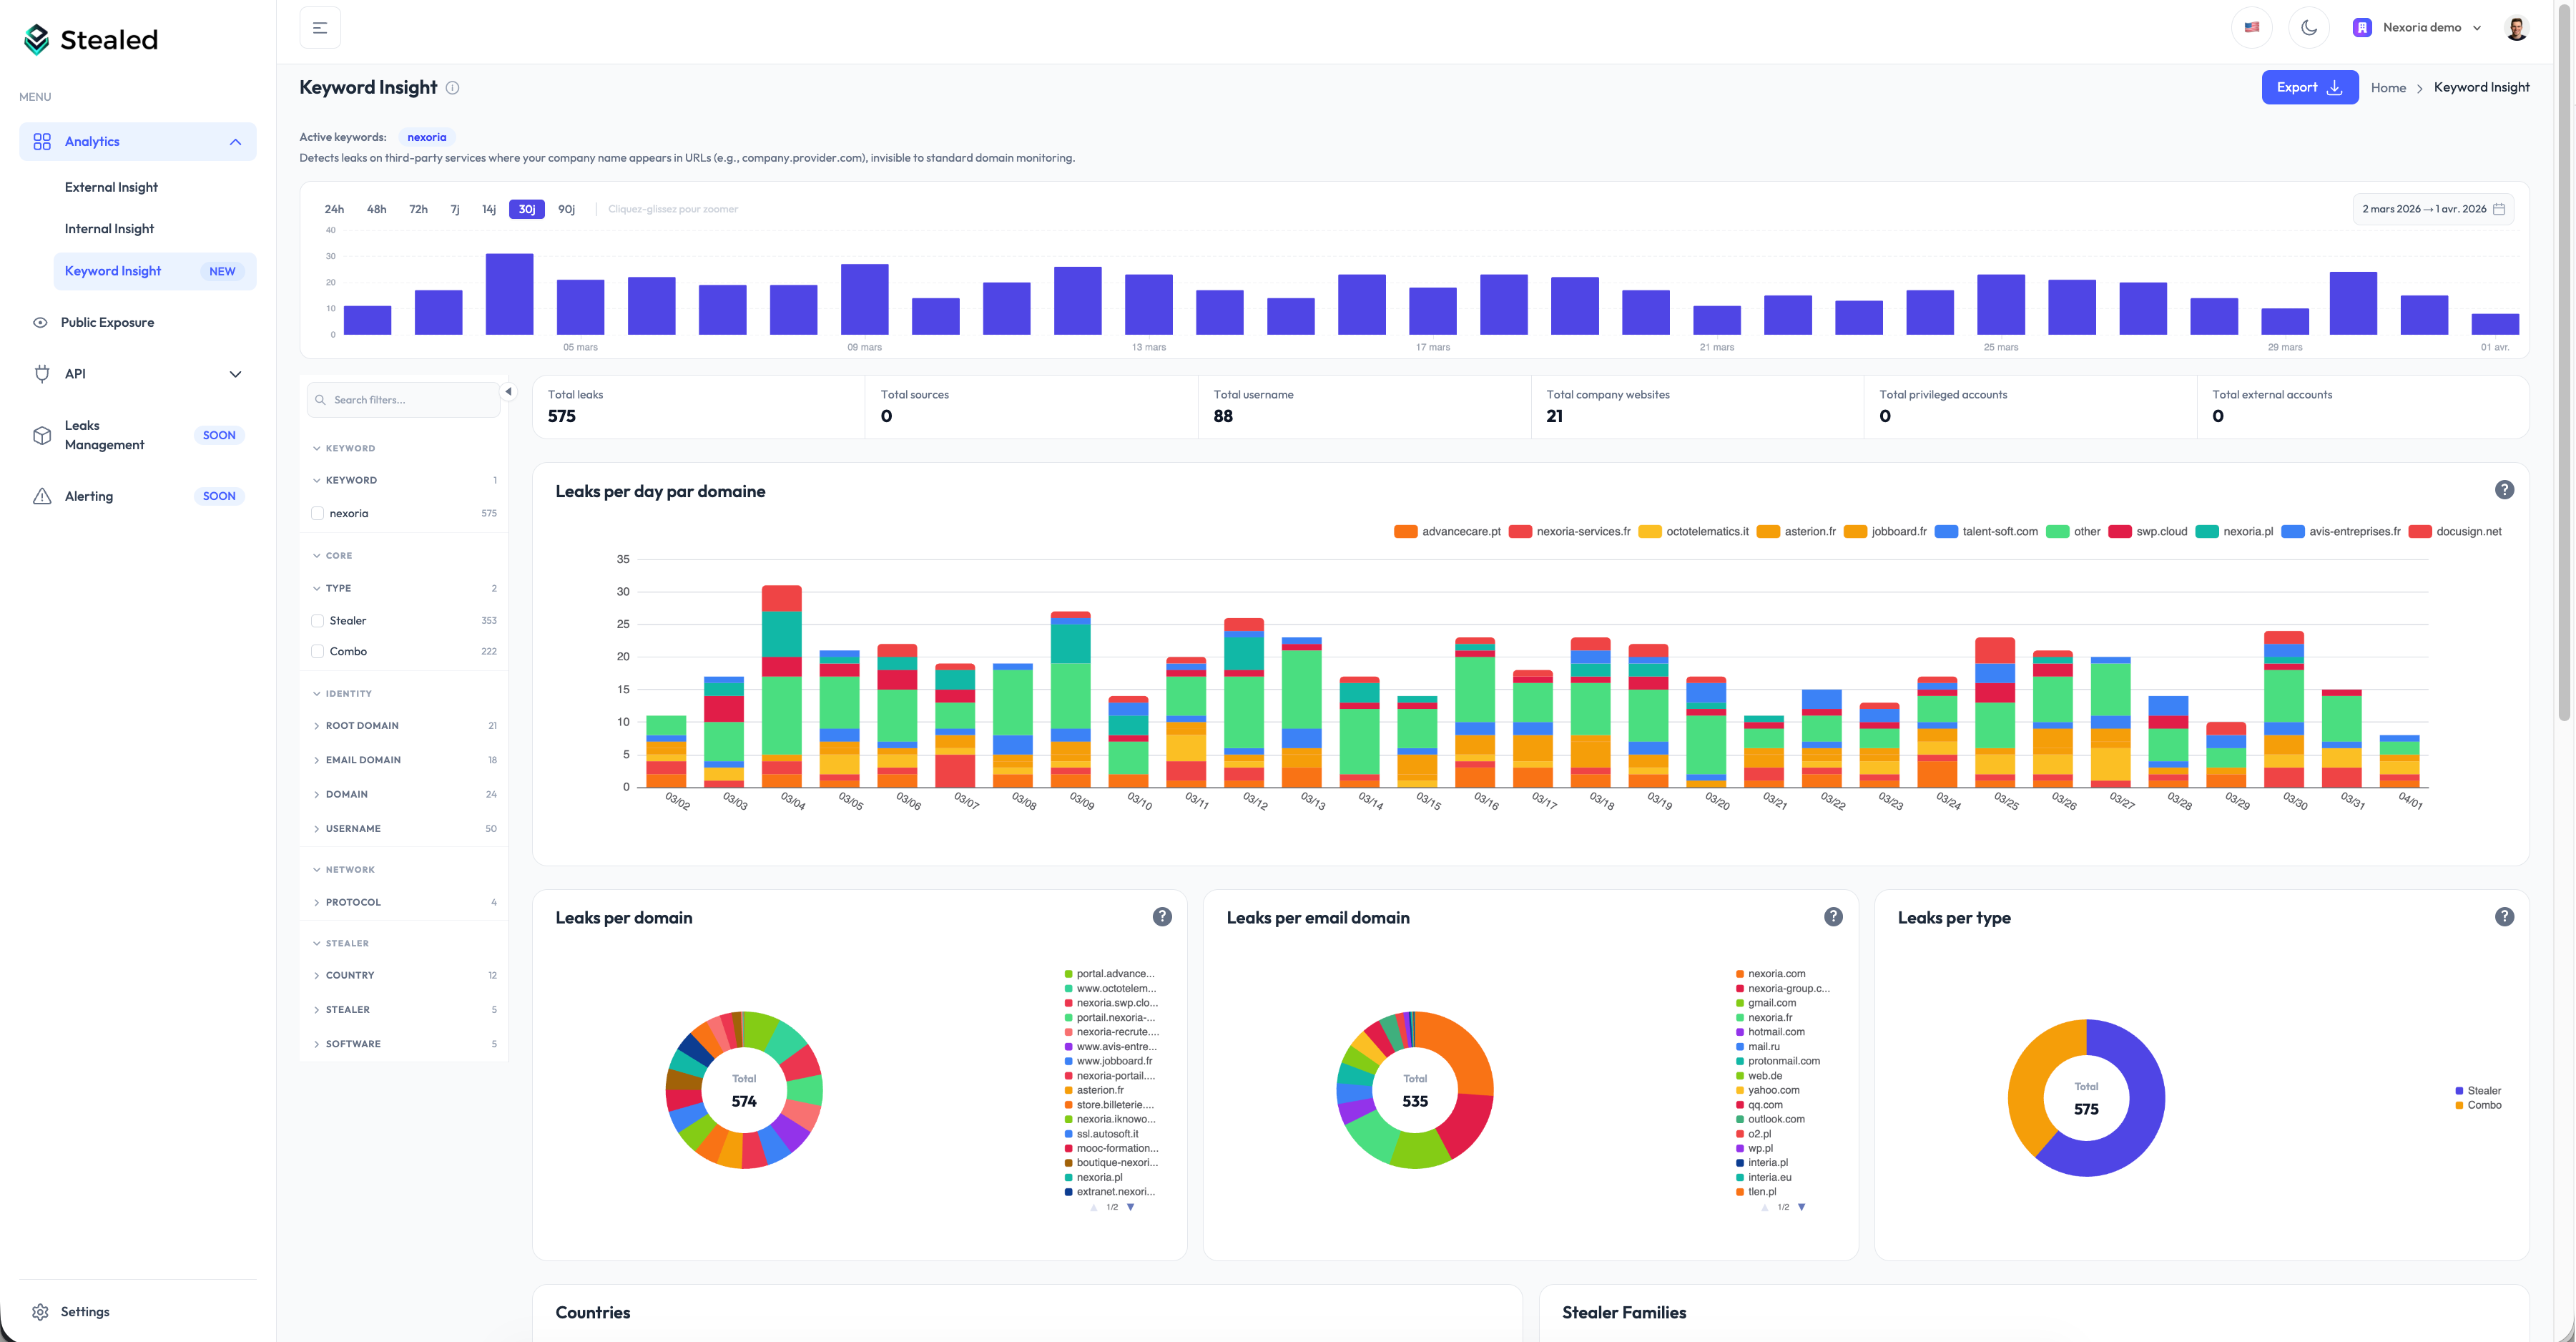
Stealed Keyword Insight dashboard

Until now, Stealed let you detect credential leaks on your own domains. But what happens when your team uses third-party tools, vendor portals, or SaaS platforms you don’t own?

Keyword Insight closes this gap.

Keyword Insight

How it works

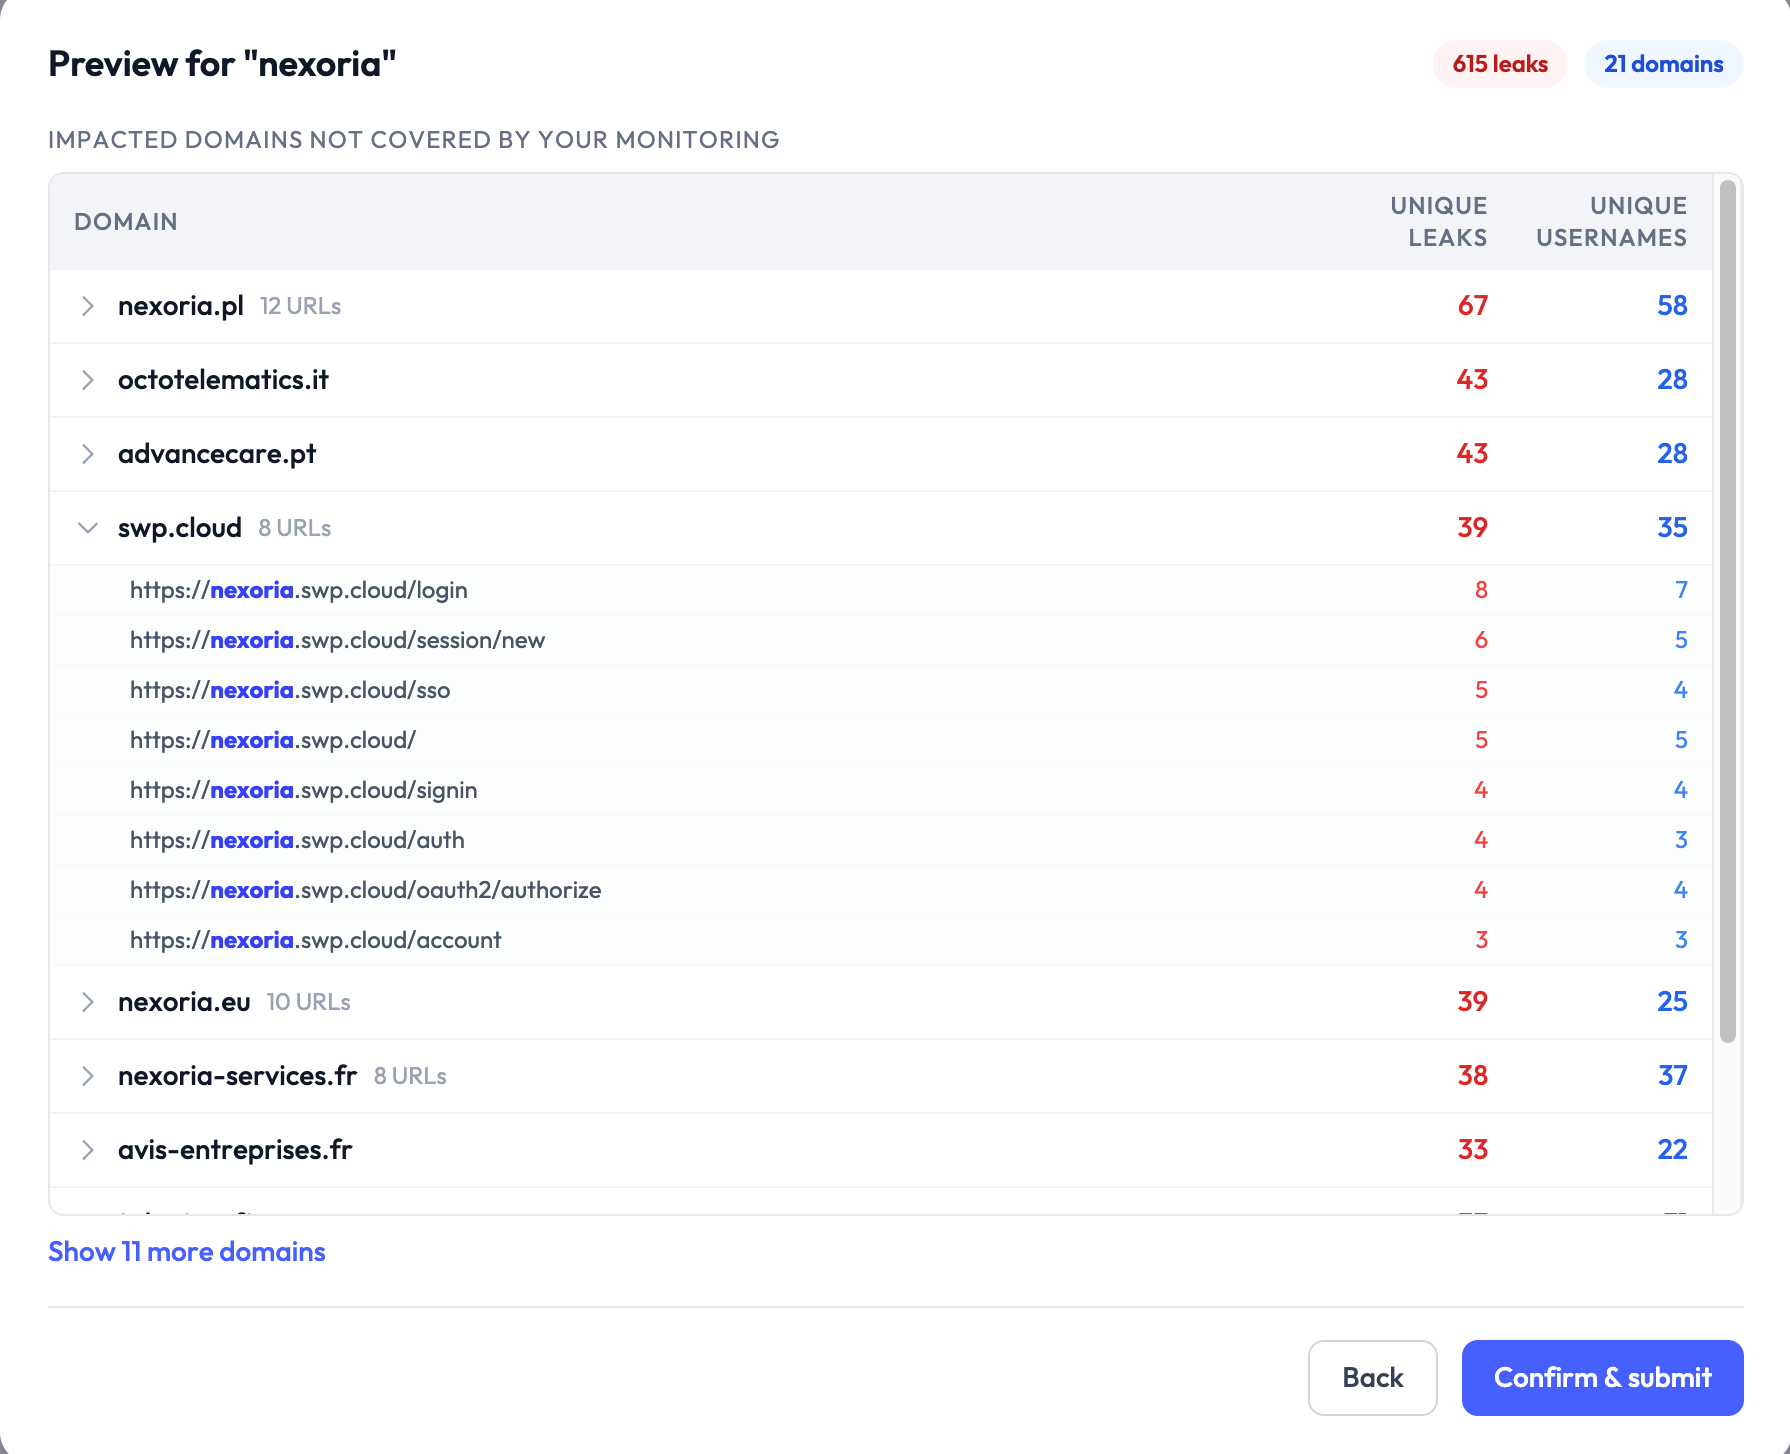
Add a keyword such as your company name or a subsidiary name and Stealed automatically scans every compromised URL containing that term, even on third-party domains.

Concrete example: Your company is called “Nexoria” → detect leaks on nexoria.vendor.com, portal-nexoria.service.io, service.com/nexoria, etc.

Keyword Insight - third-party detection

What you get

  • Dedicated dashboard with a leak timeline, breakdown by type, by stealer, and by country
  • Advanced filters: domain, source, country, browser, machine name…
  • Preview before activation: see results before confirming the keyword
  • PDF export for your security reports

Keyword Insight - dashboard

Availability

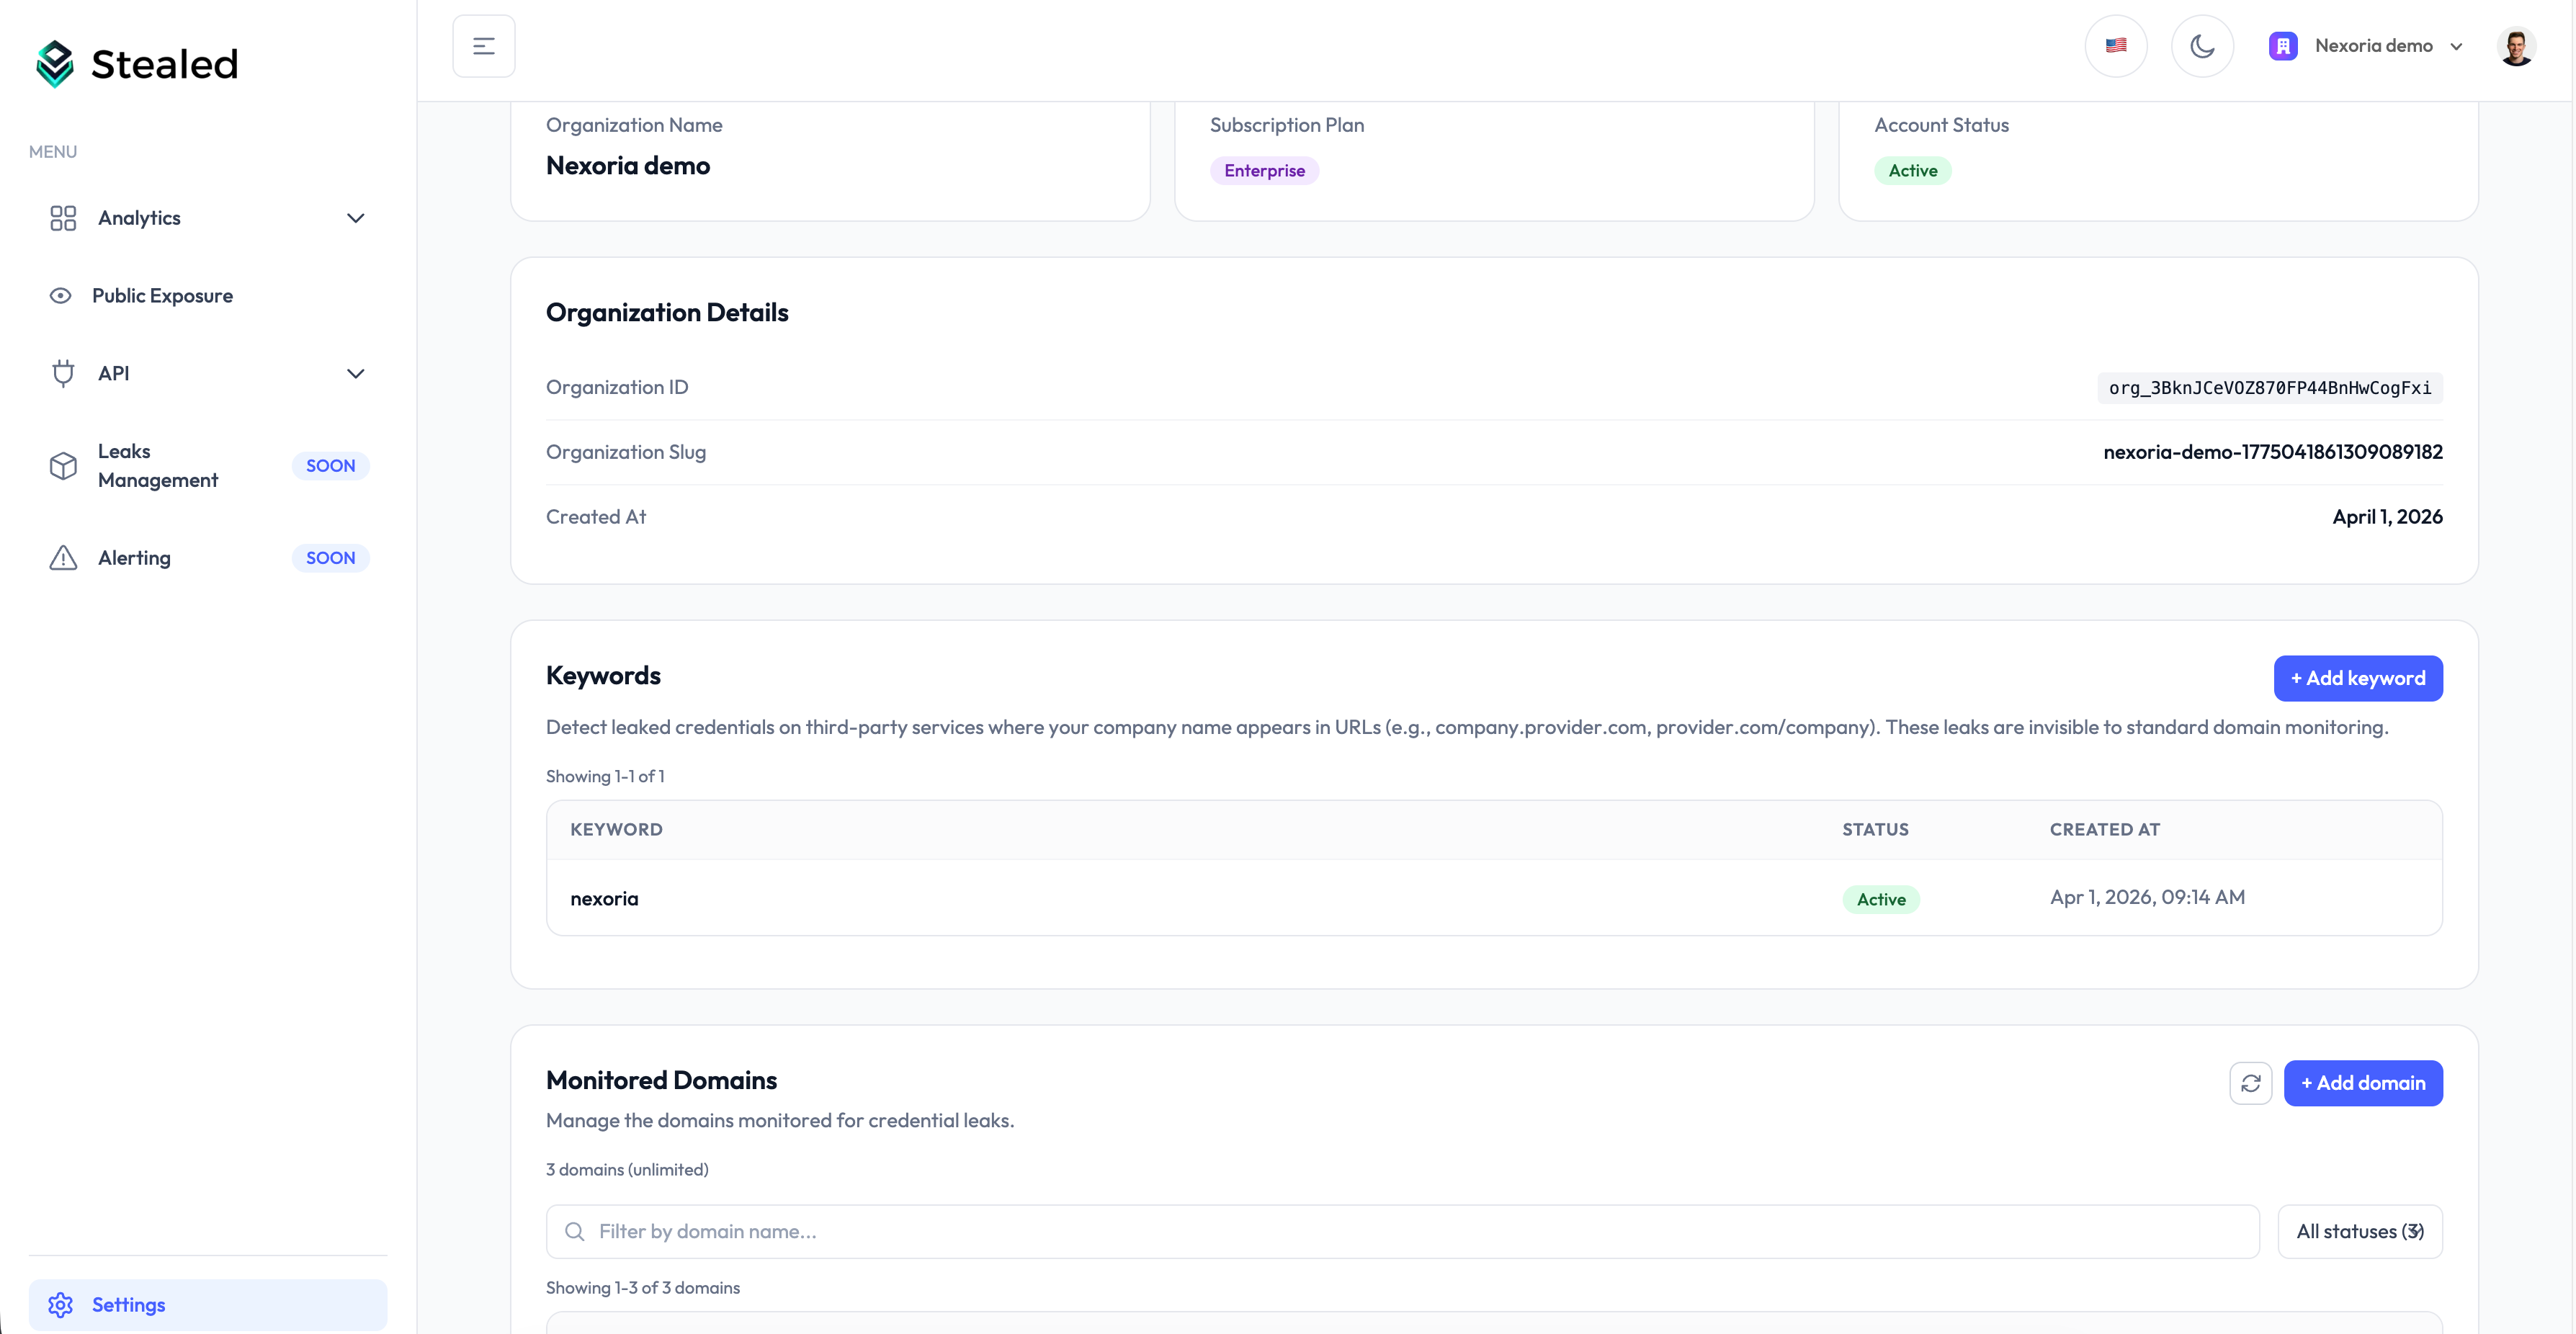
Keyword Insight is available now to every organization. Head to Settings > Keywords to configure your first keywords.

GA

Stealed v1.0

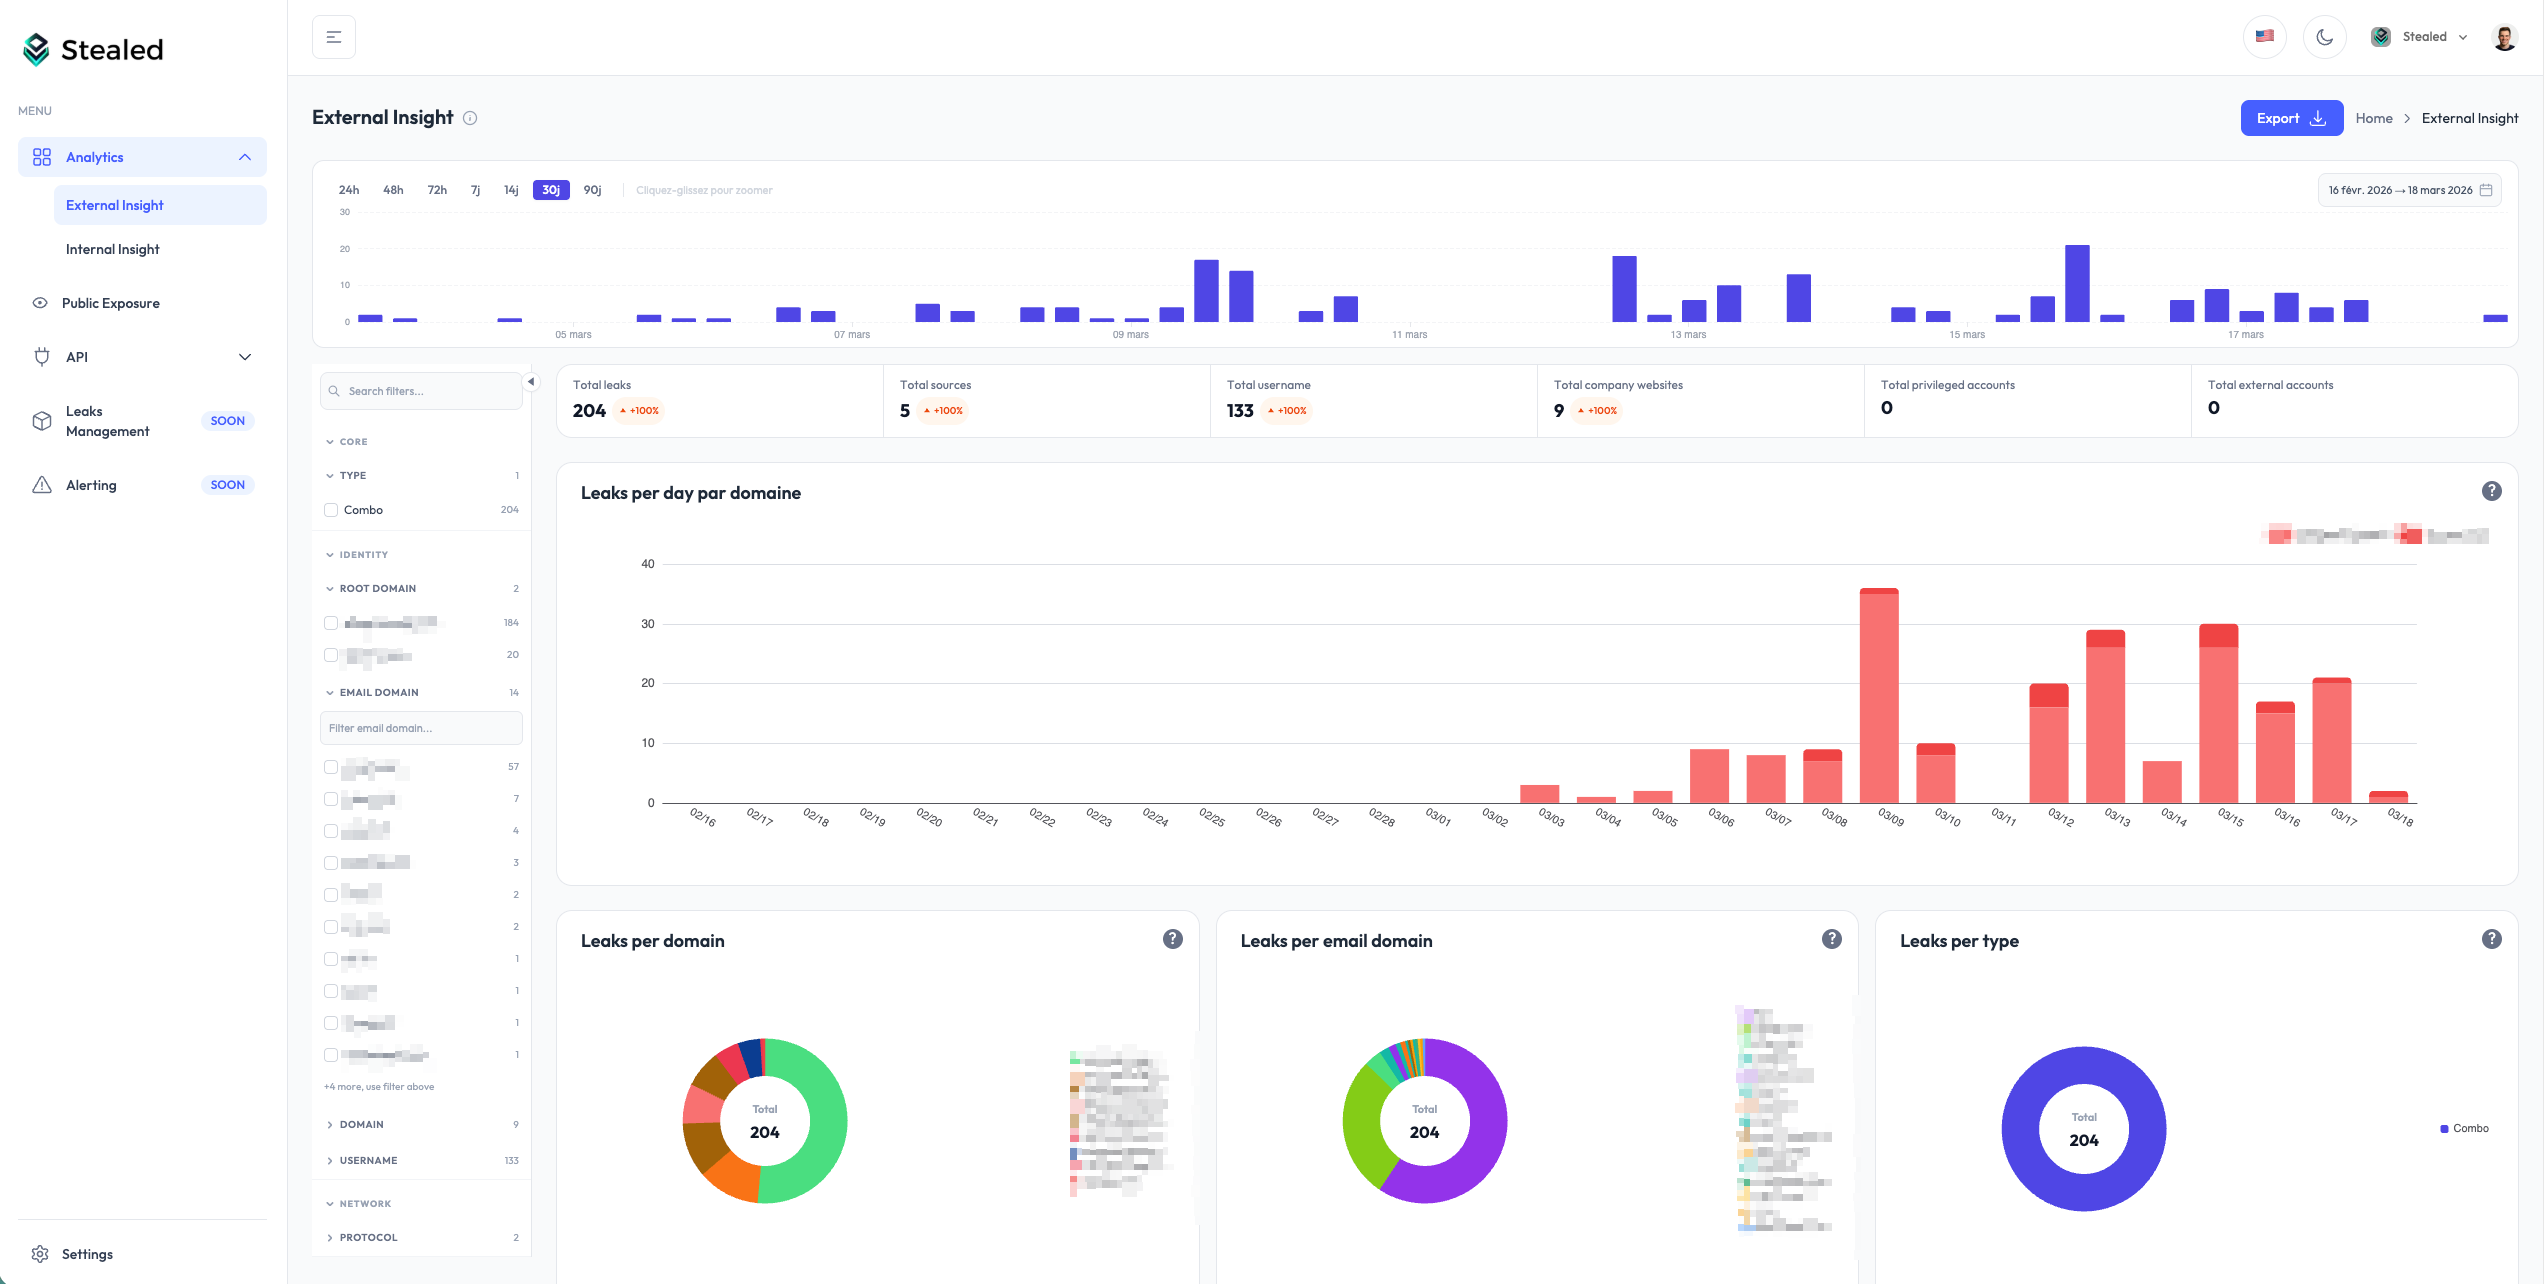
First official release: guided onboarding, domain management, faceted filters, leak detail view, API code generation, Public Exposure, new chart system, unlimited retention, and PDF export.

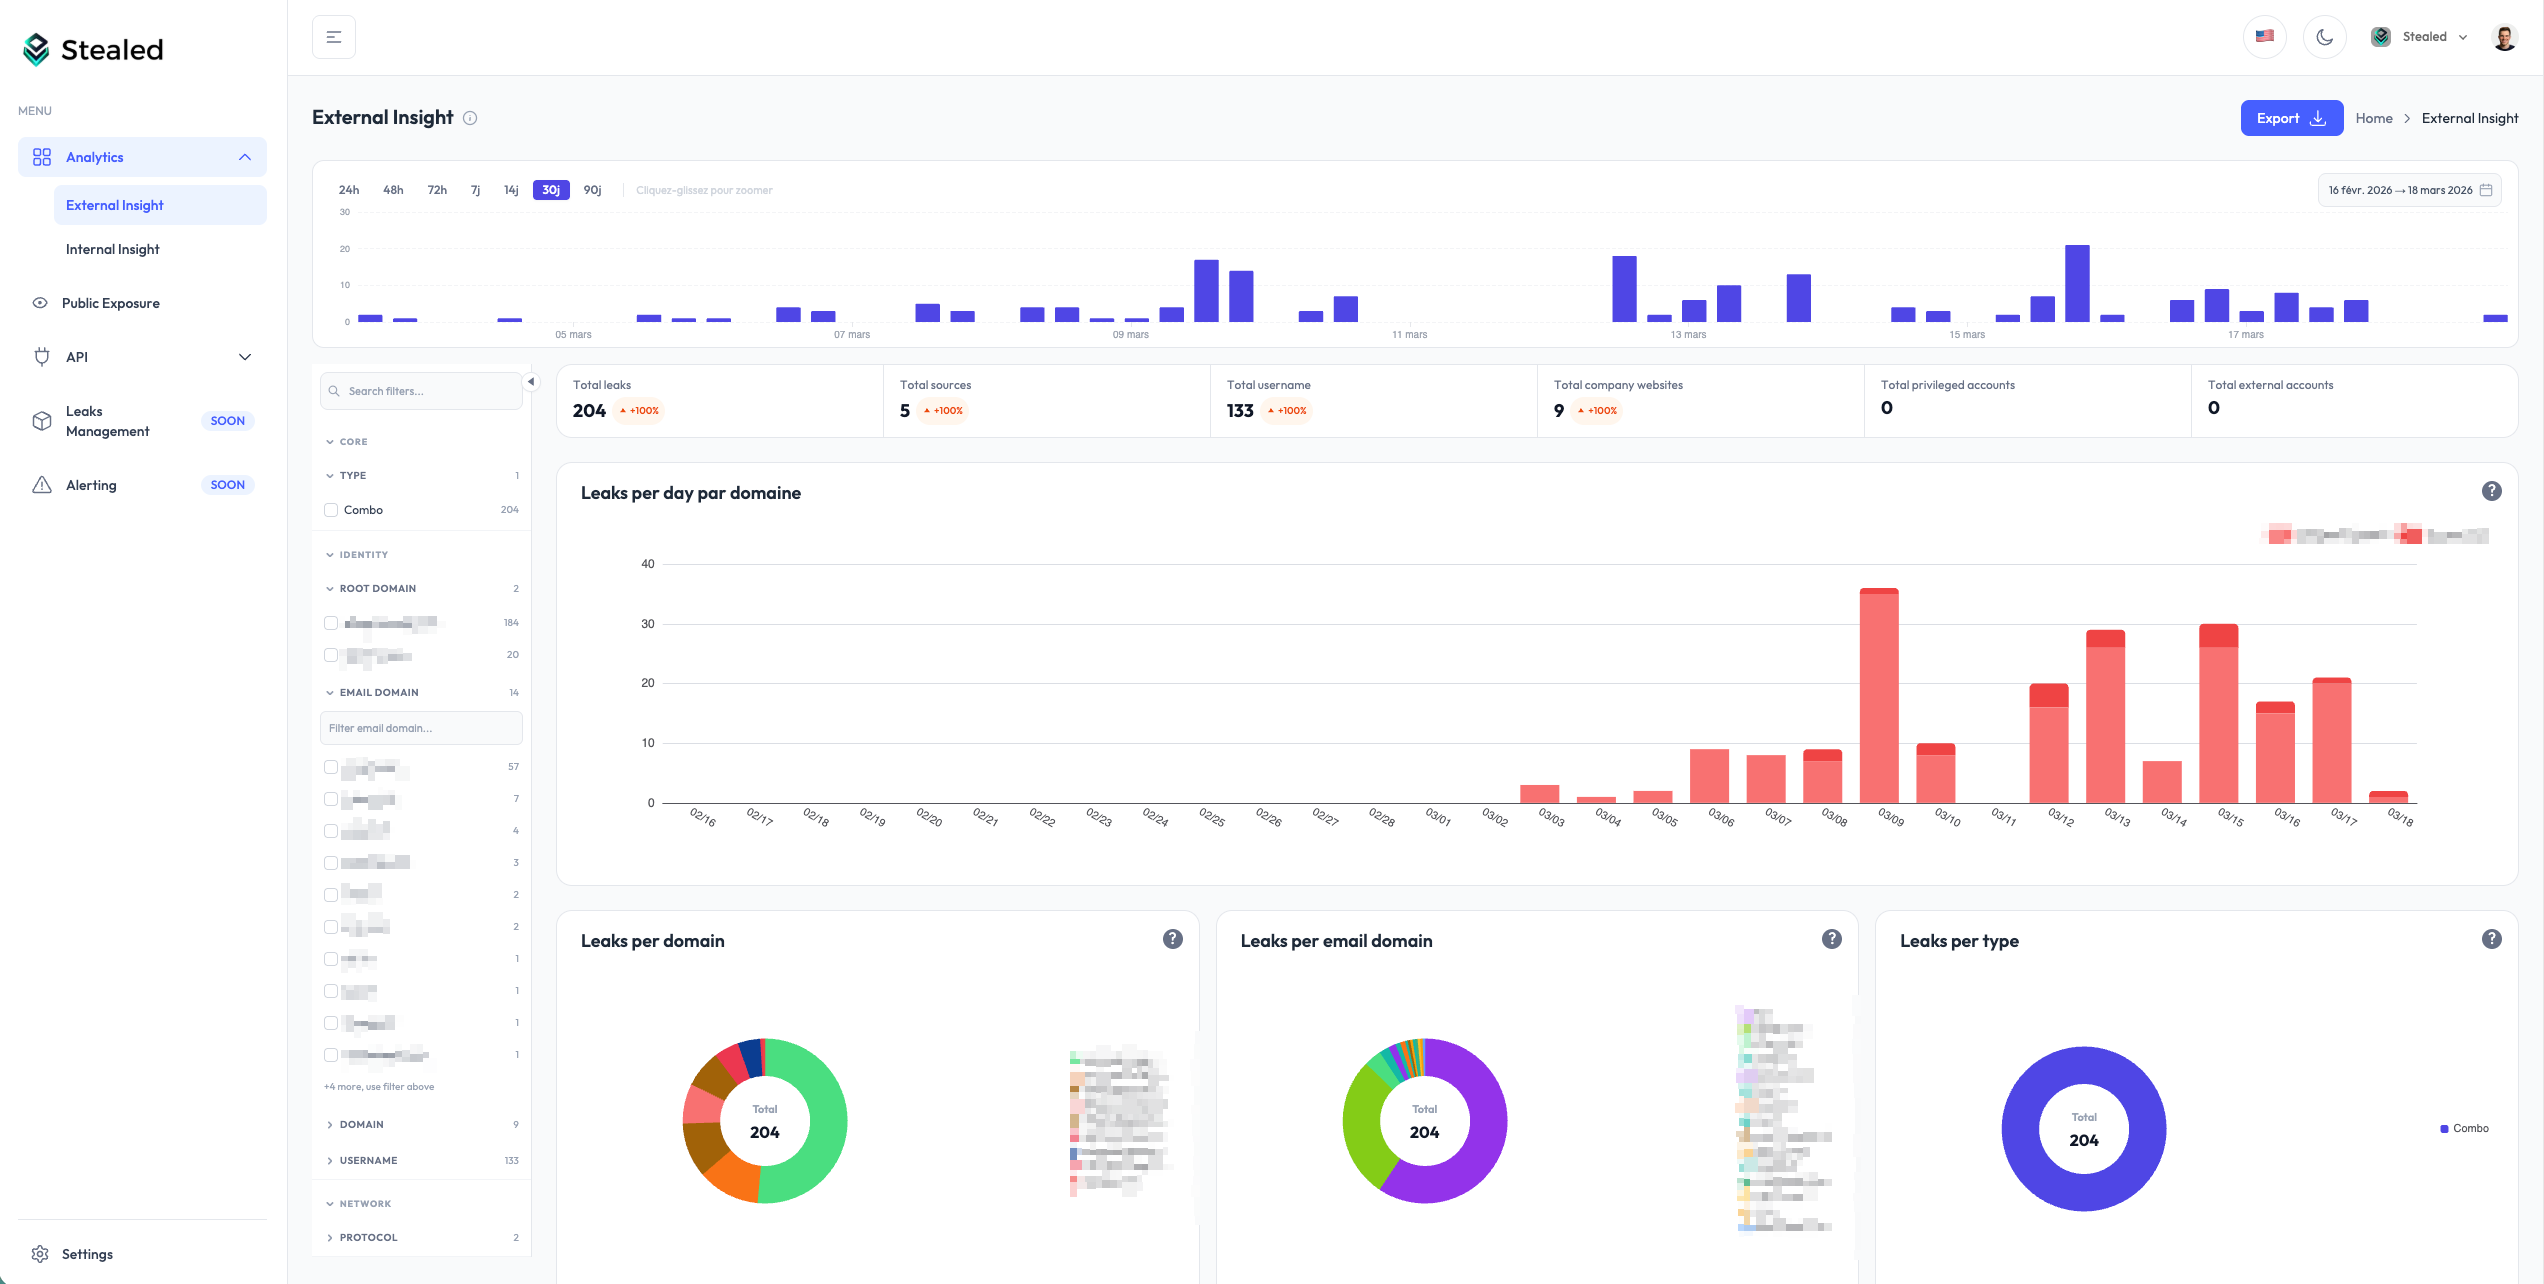
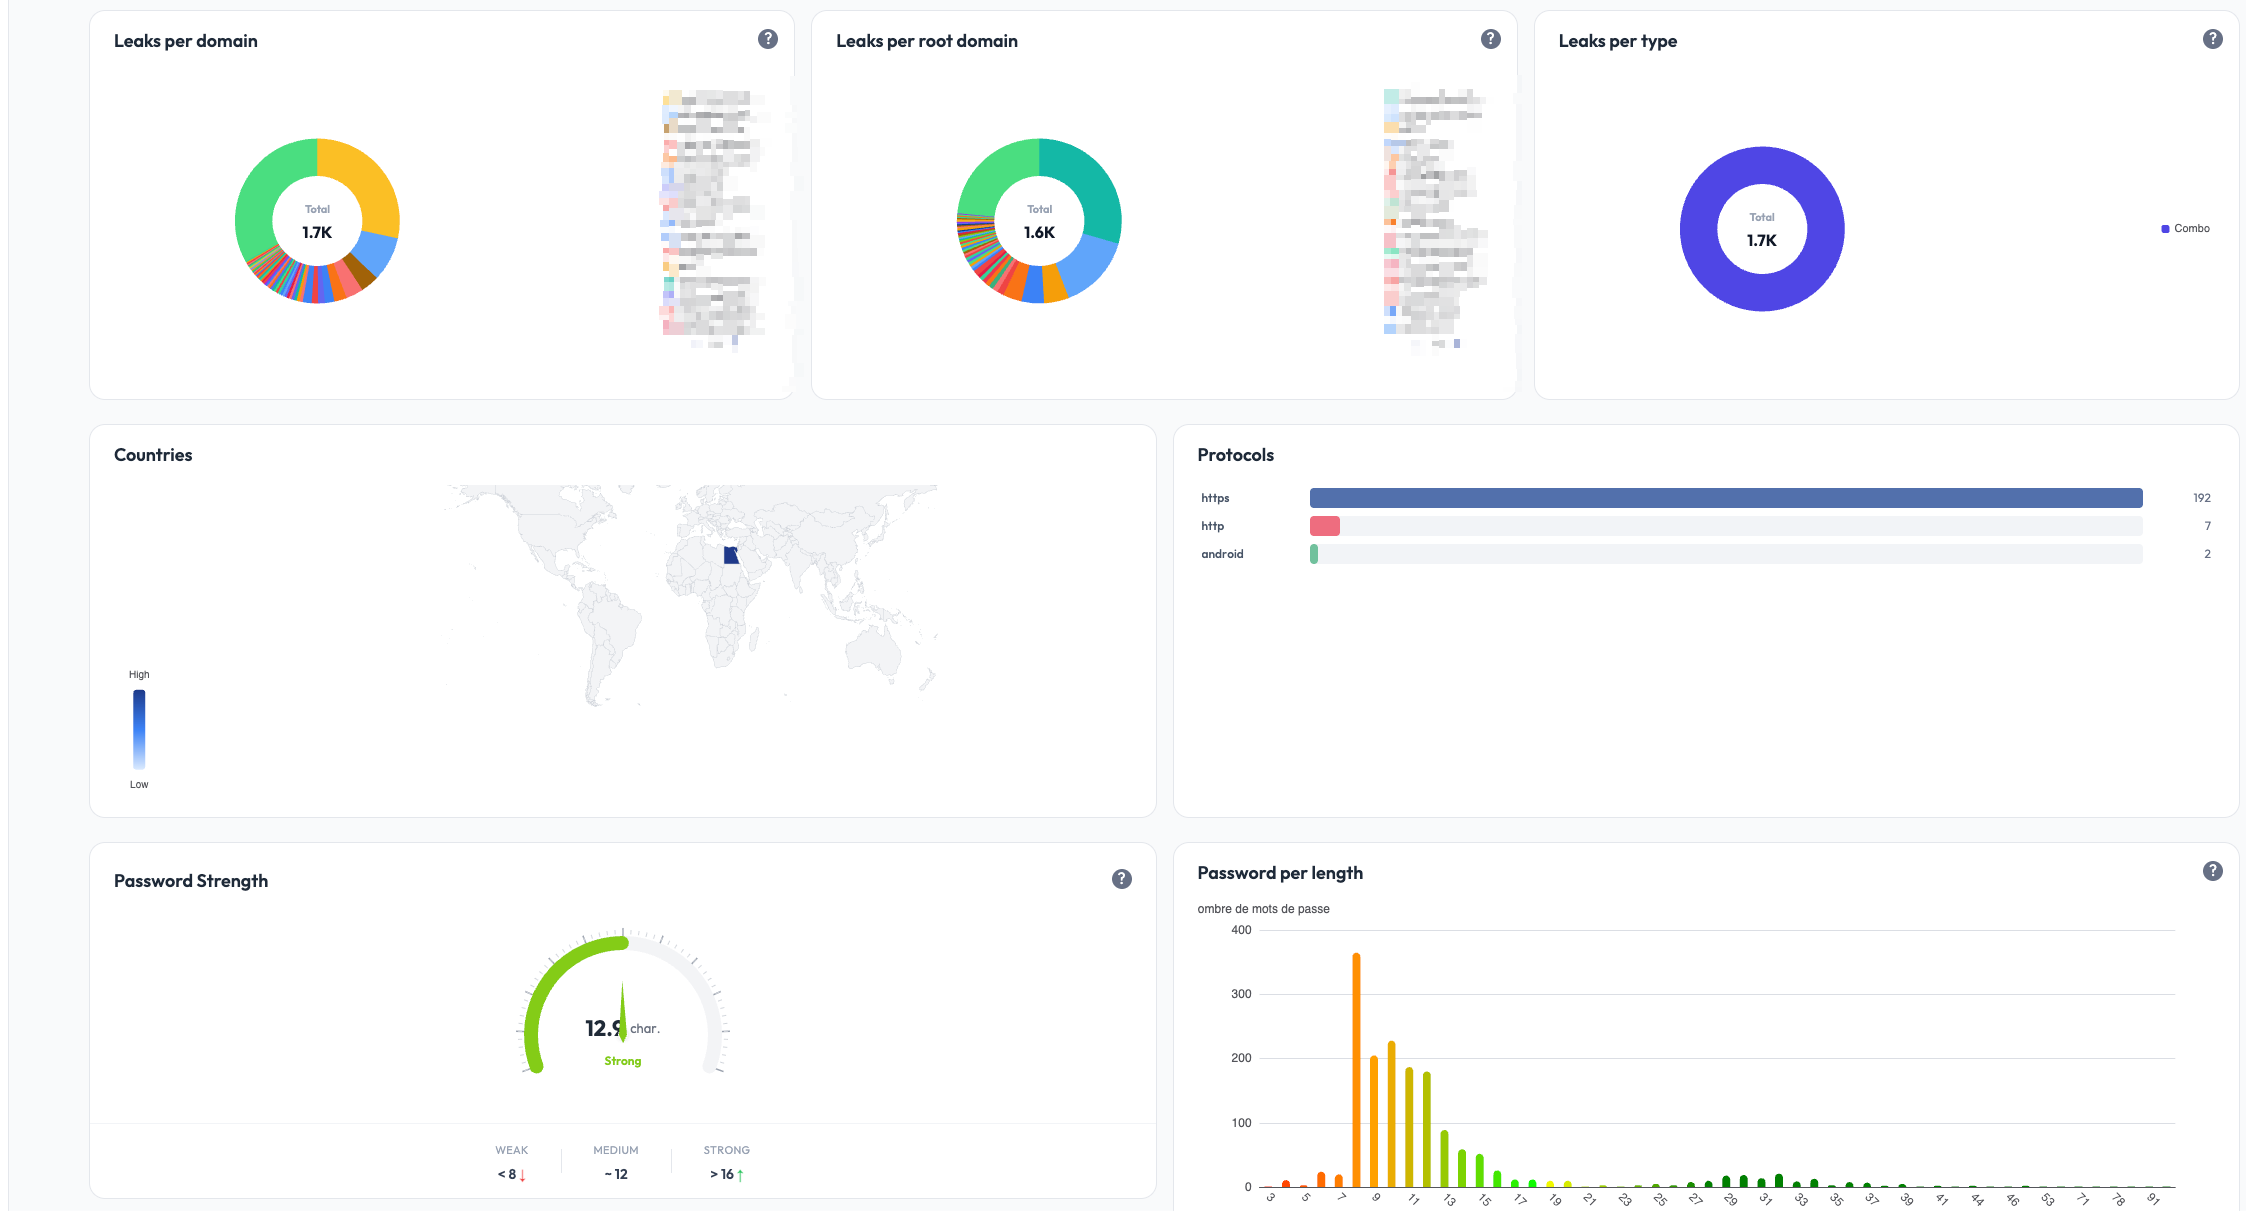
Stealed v1.0 External Insight dashboard

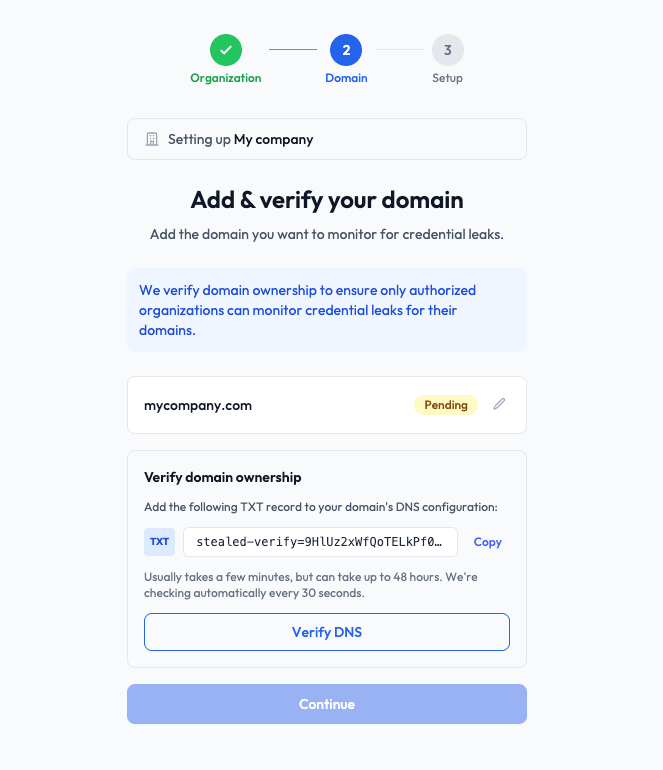
Guided onboarding

A configuration assistant walks new organizations through:

  1. Creating the organization
  2. Adding and verifying the first domain
  3. Reaching the dashboard with data

The assistant resumes where you left off if you exit mid-flow.

Guided onboarding

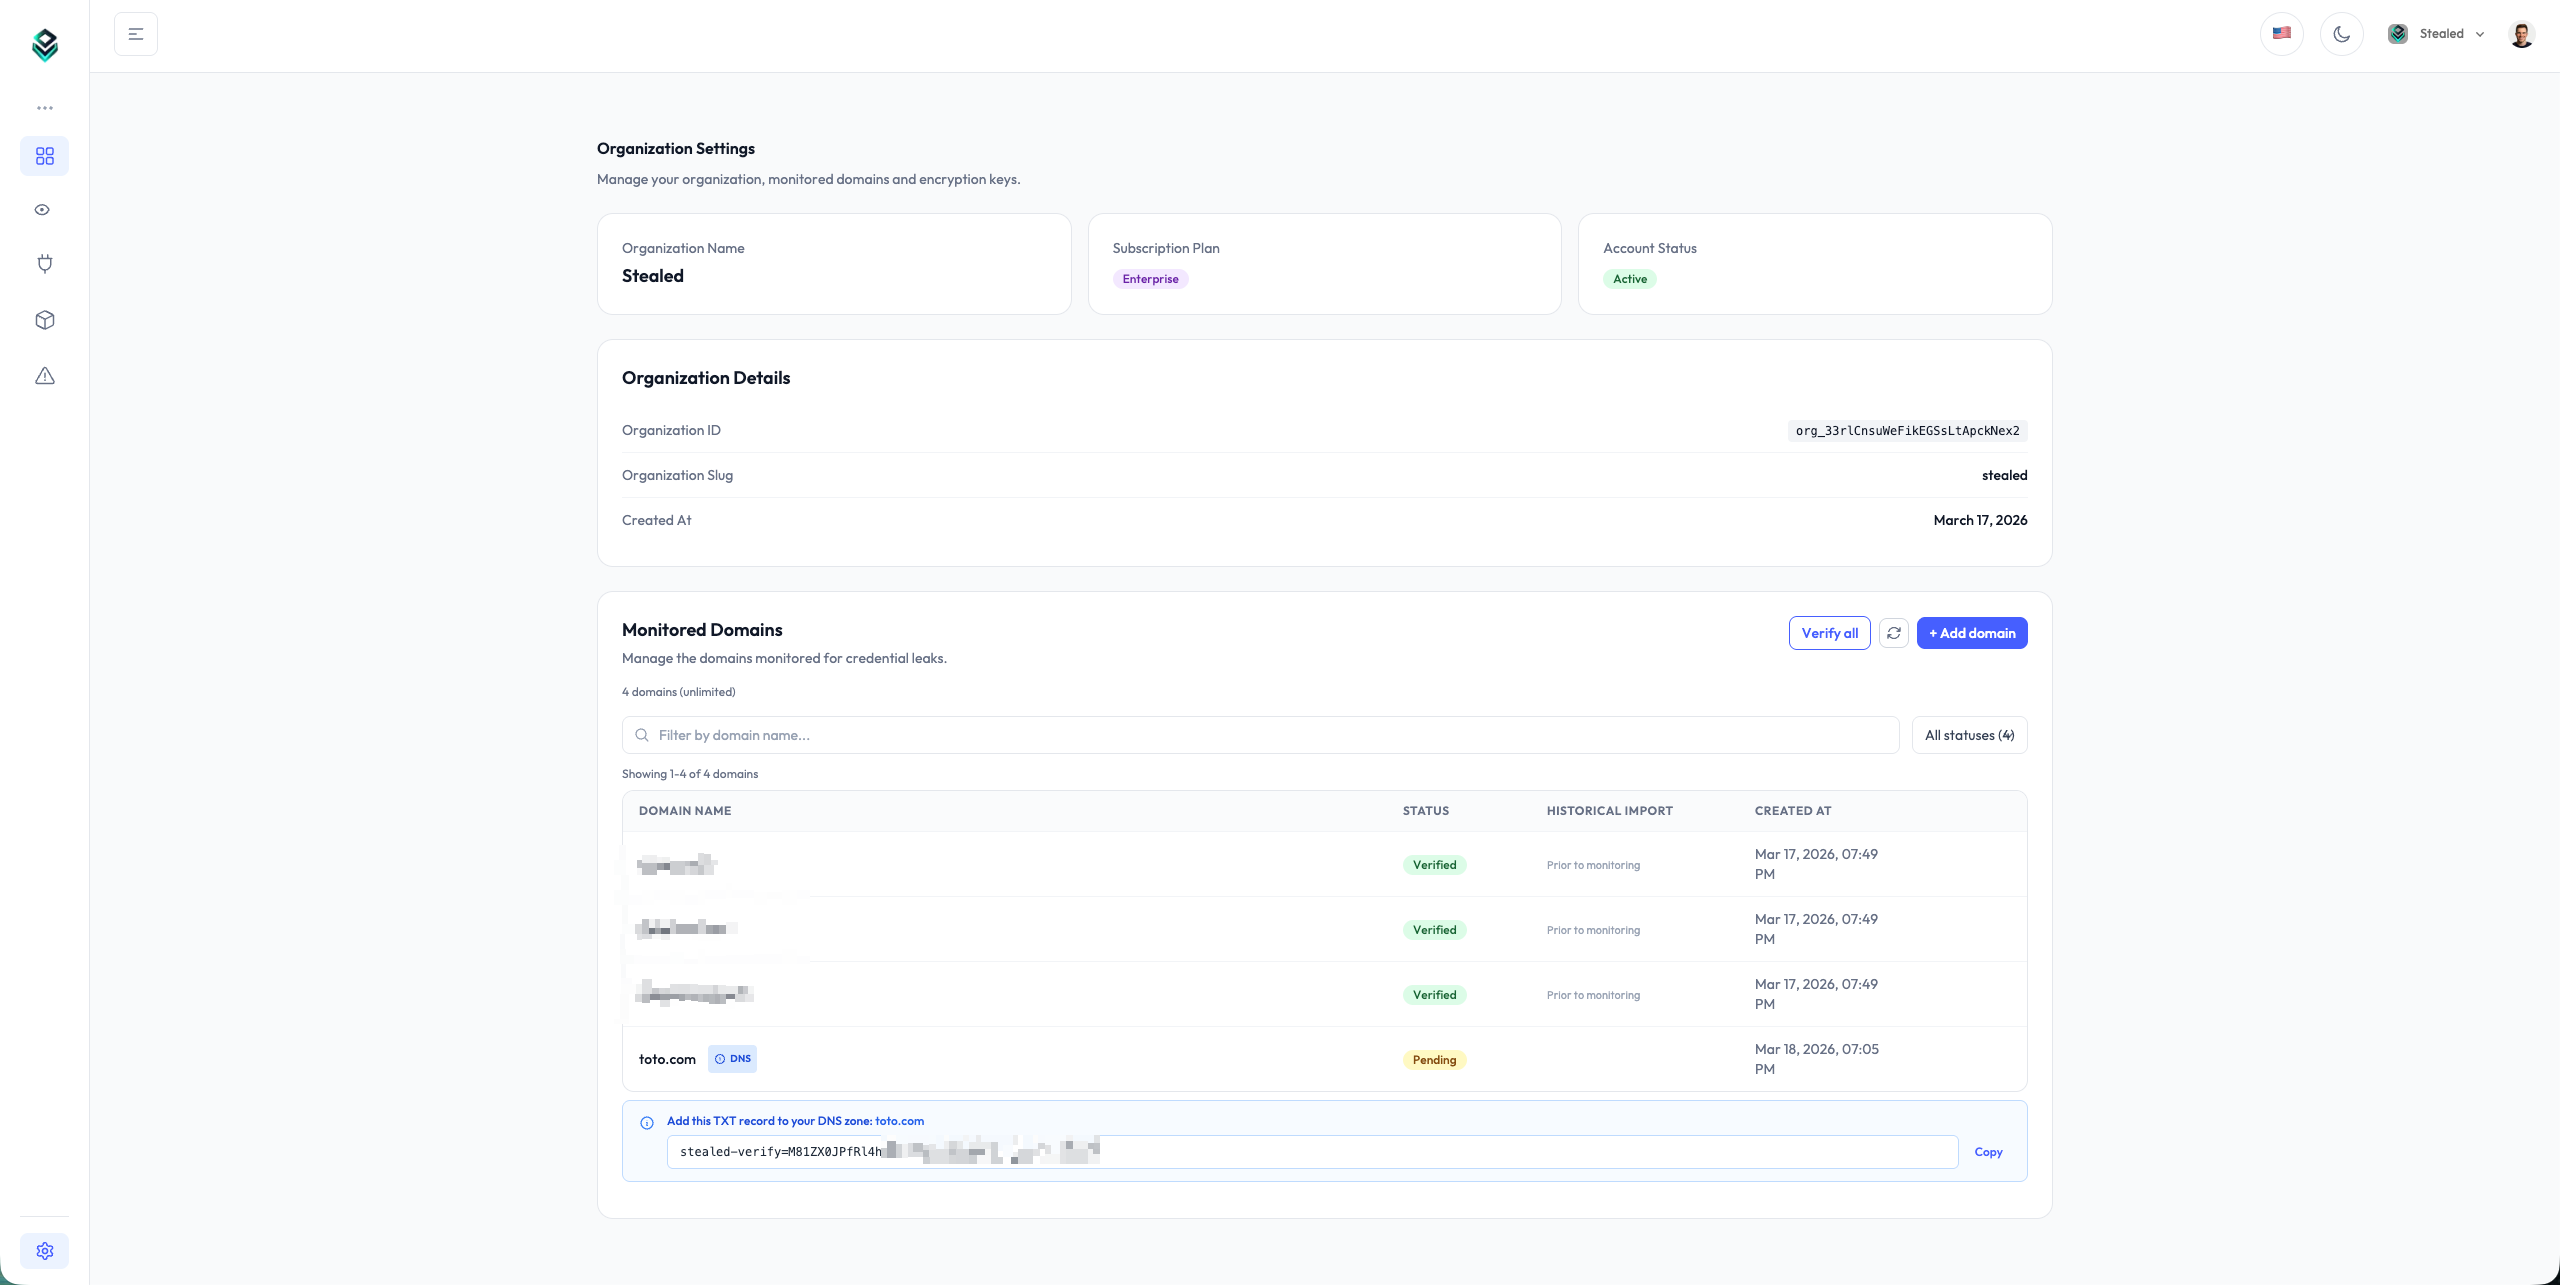
Monitored domain management

From the Settings page, add or remove monitored domains at any time.

When a domain is verified, the full history of existing leaks is automatically attached to your workspace. Data is available immediately, with no waiting period.

Monitored domain management

Faceted filters

A side filter panel is available on every analytics view. Filters are organized by category:

  • Core: leak type (Combo / Stealer)
  • Identity: root domain, email domain, domain, username
  • Network: protocol
  • Stealer: stealer family, country

Click a value to filter instantly. Each category shows the number of available values and includes a search bar to quickly find a filter among hundreds of values.

Faceted filters

Detailed leak view

The leak view has been completely redesigned.

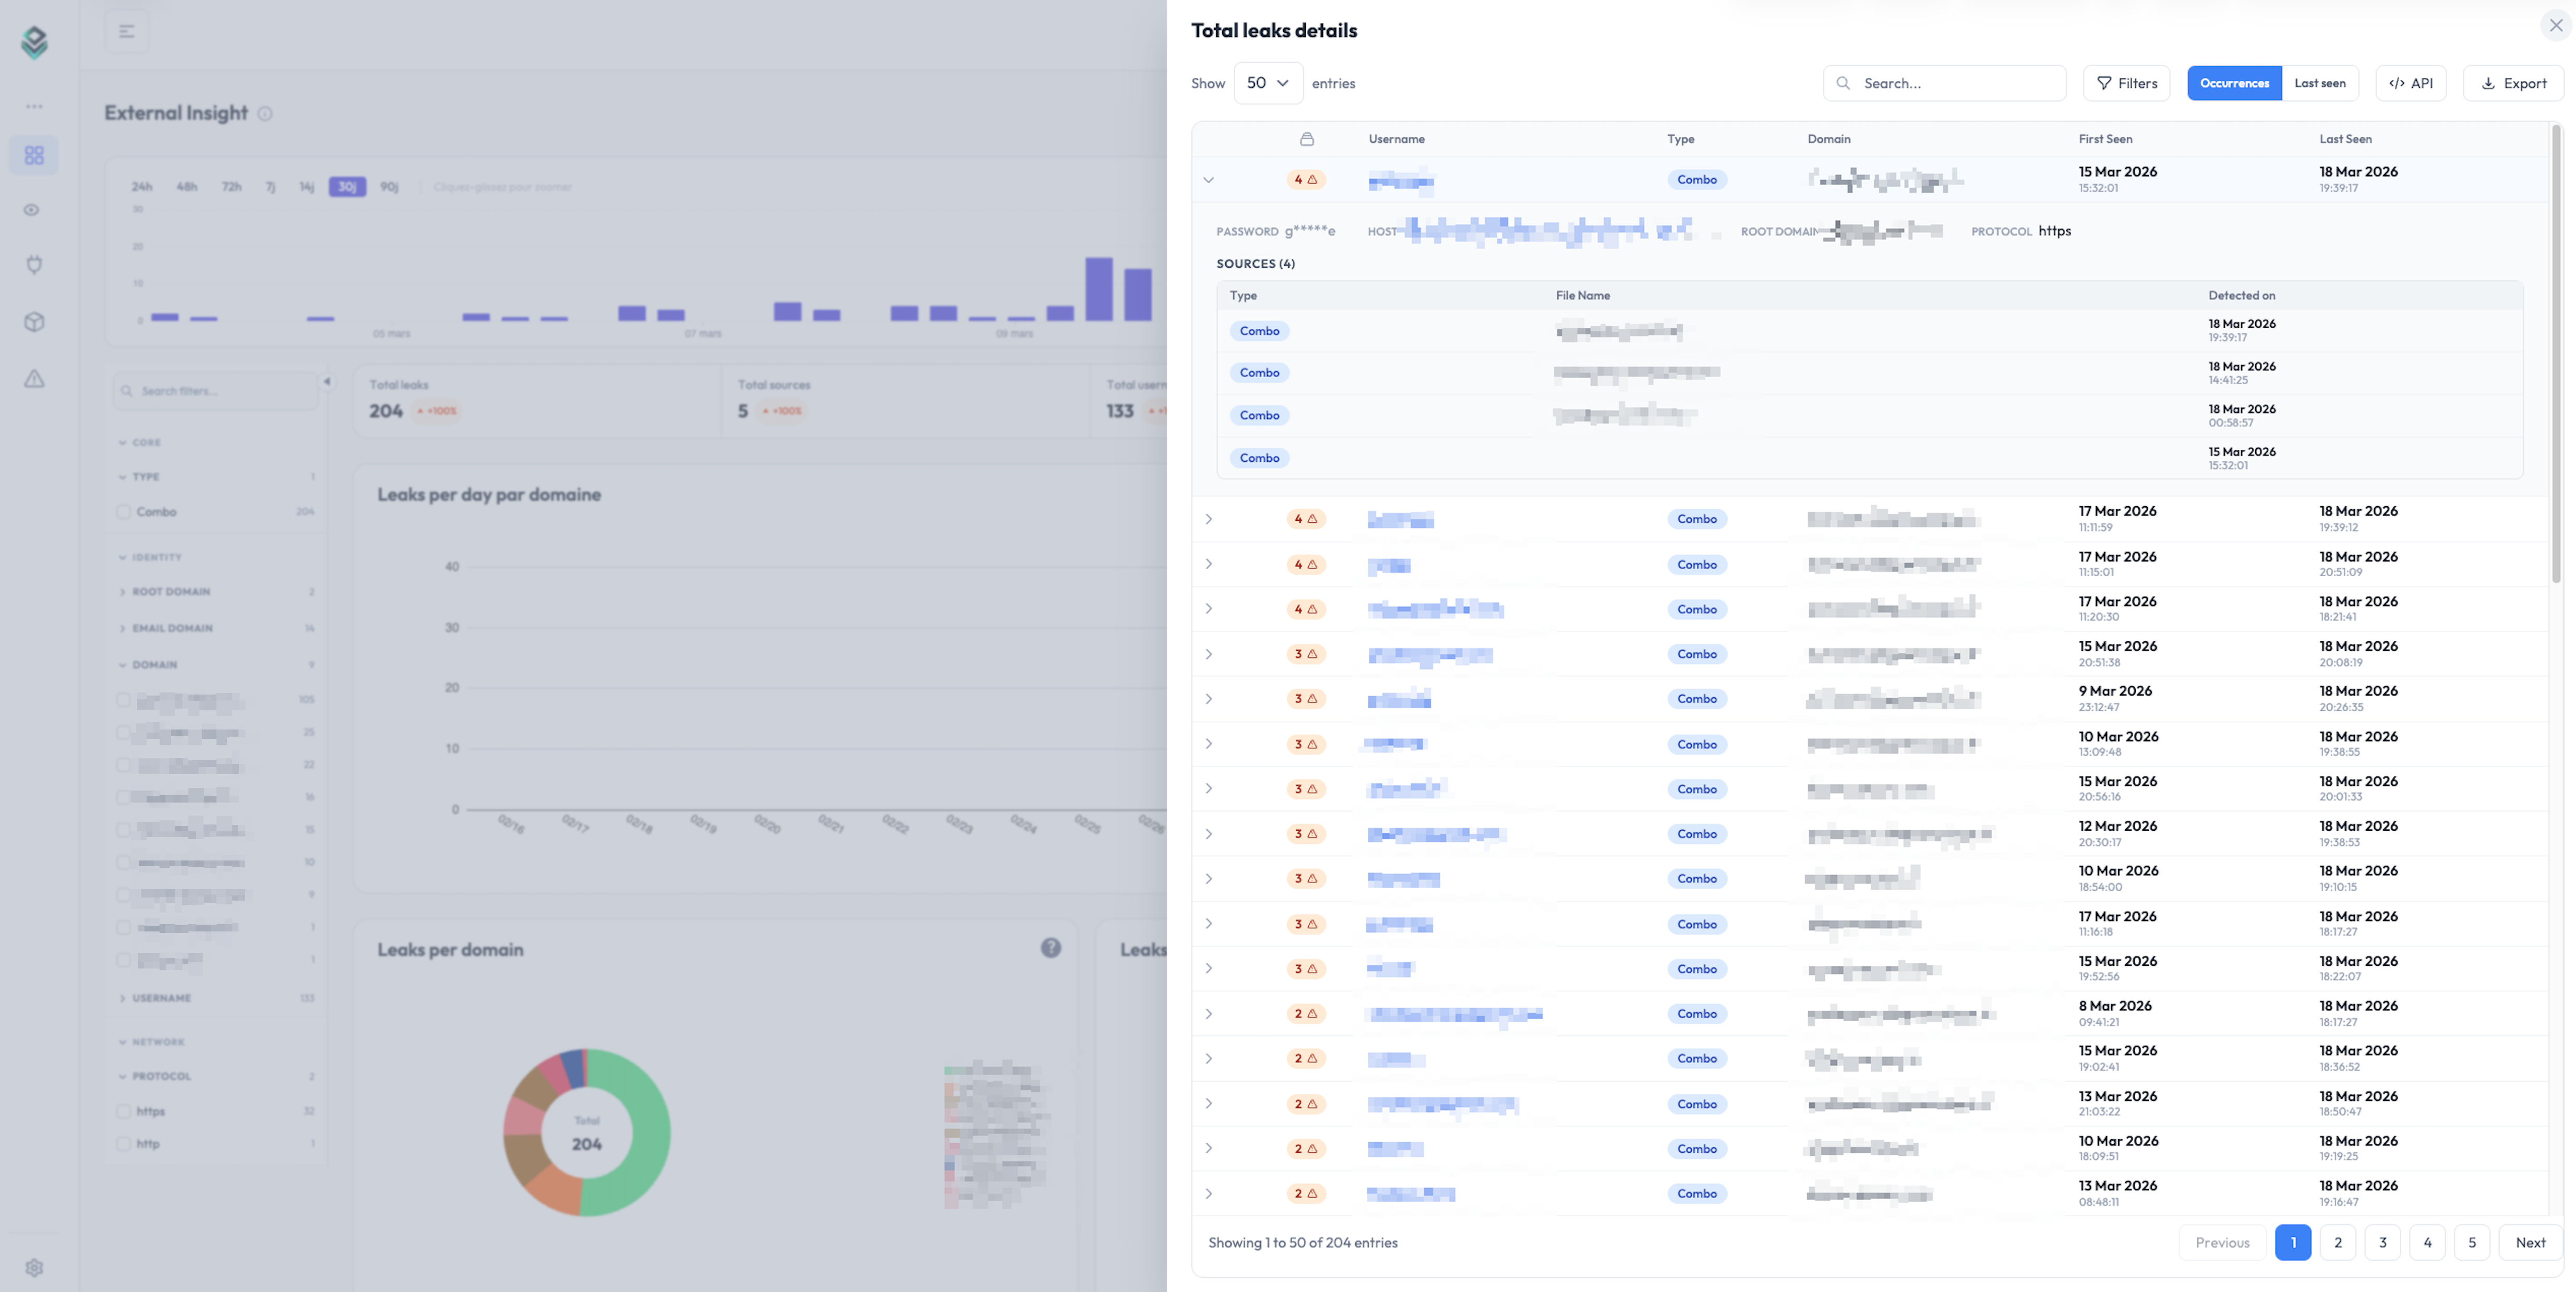
Automatic grouping: identical leaks (same identifier, same hostname, same password) are merged into a single row with an occurrence counter. Expand a row to access the full detail: masked password, host, root domain, email domain, protocol.

Source history: click “Load sources” to see each individual detection with its date, type, and source file. You can trace the complete history of a leak, from its first appearance to the latest.

First Seen / Last Seen: every leak shows its first and last detection dates so you can quickly assess whether it is recent or persistent.

Detailed leak view

“New Leaks Since” filter

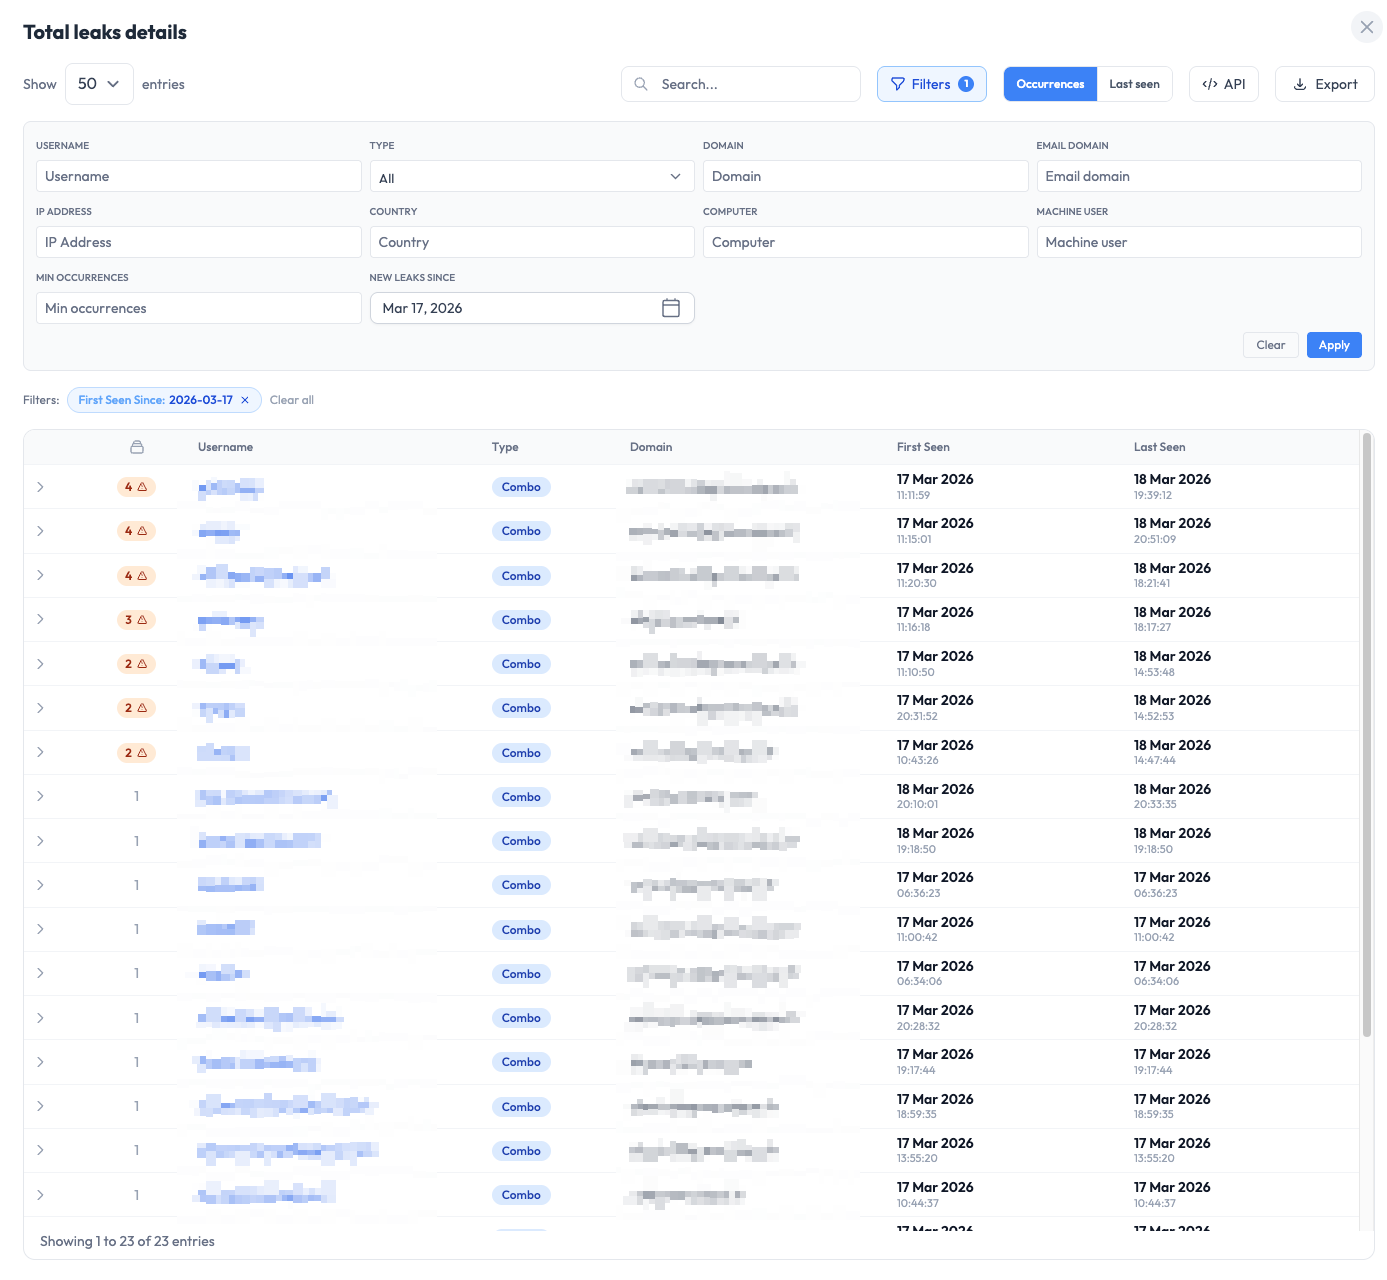
In detail tables, a “New Leaks Since” filter isolates only leaks that appeared after a given date.

Combined with the dashboard date range, this filter lets you, for example, browse the last 90 days but display only leaks new since 3 days ago.

It’s particularly useful for API integrations: by filtering leaks new since the last sync, you avoid reprocessing data you already have.

New Leaks Since filter

Automatic API call generation

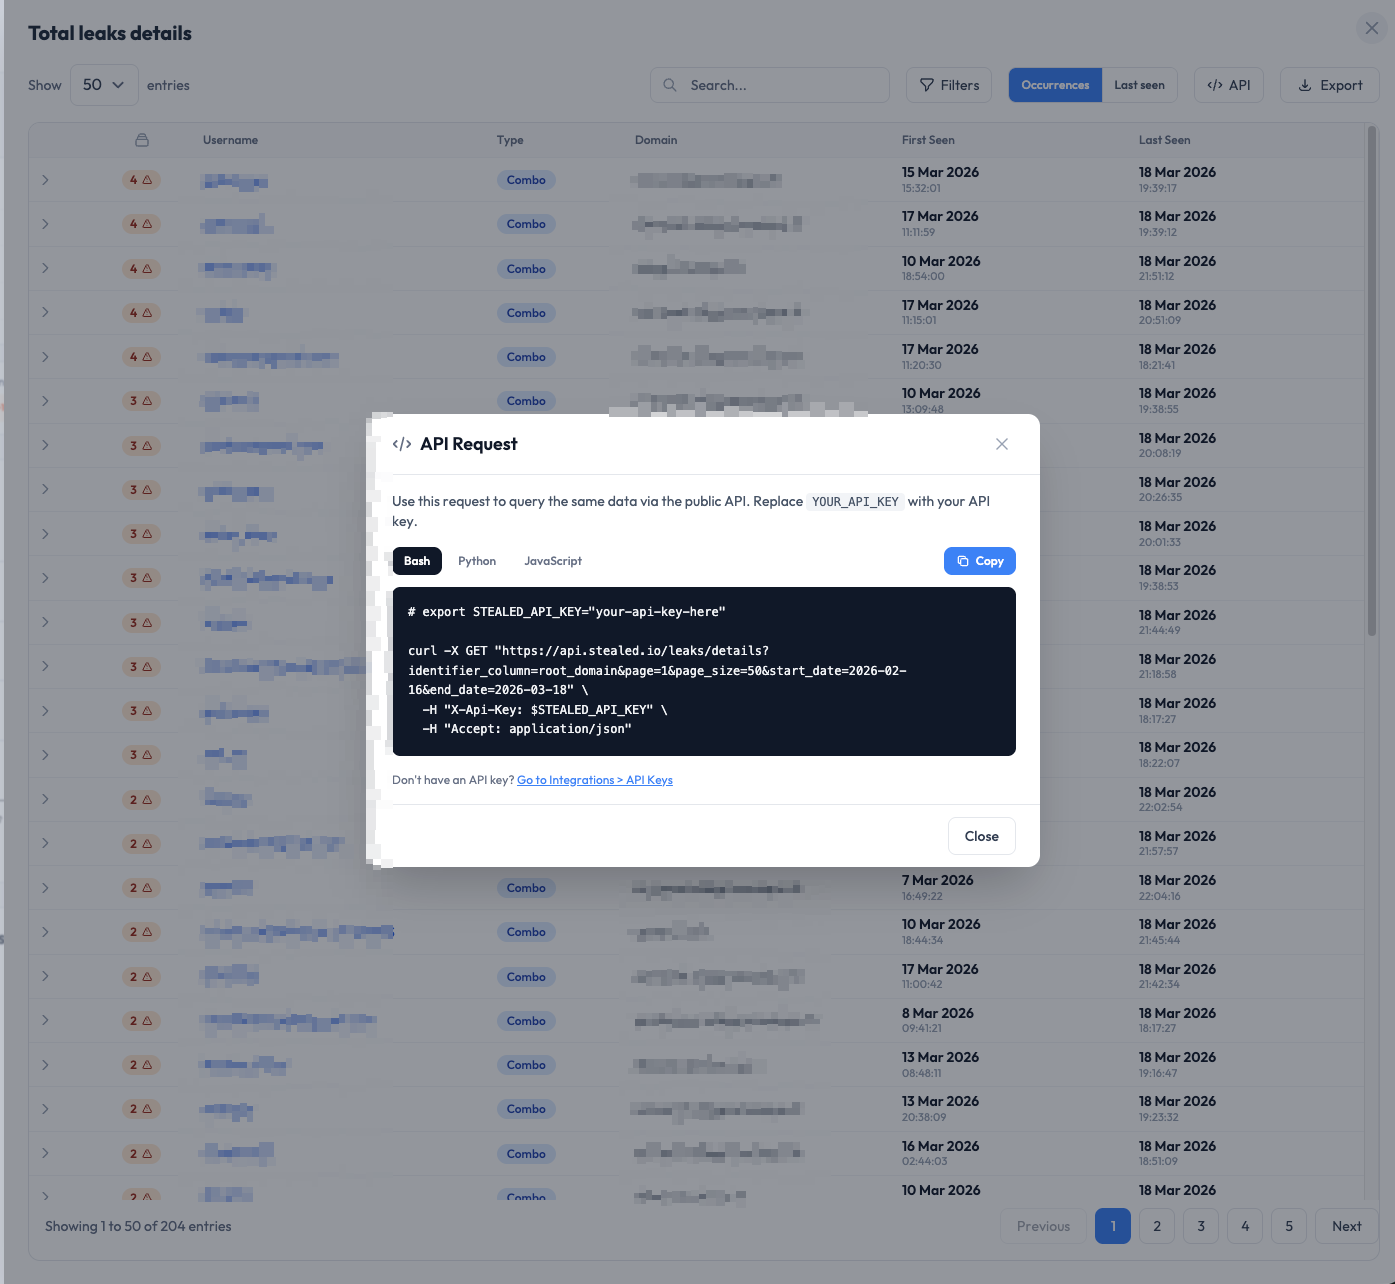
From any detail table, click “API” to automatically generate the call code matching your current view.

All applied filters (domain, date, type, “New Leaks Since”…) are baked into the generated snippet, available in Bash, Python, and JavaScript. Just replace the API key and paste the code into your system.

The workflow: explore your data in the dashboard, refine with filters, then export the API request in one click to plug it into your internal tools.

Automatic API call generation

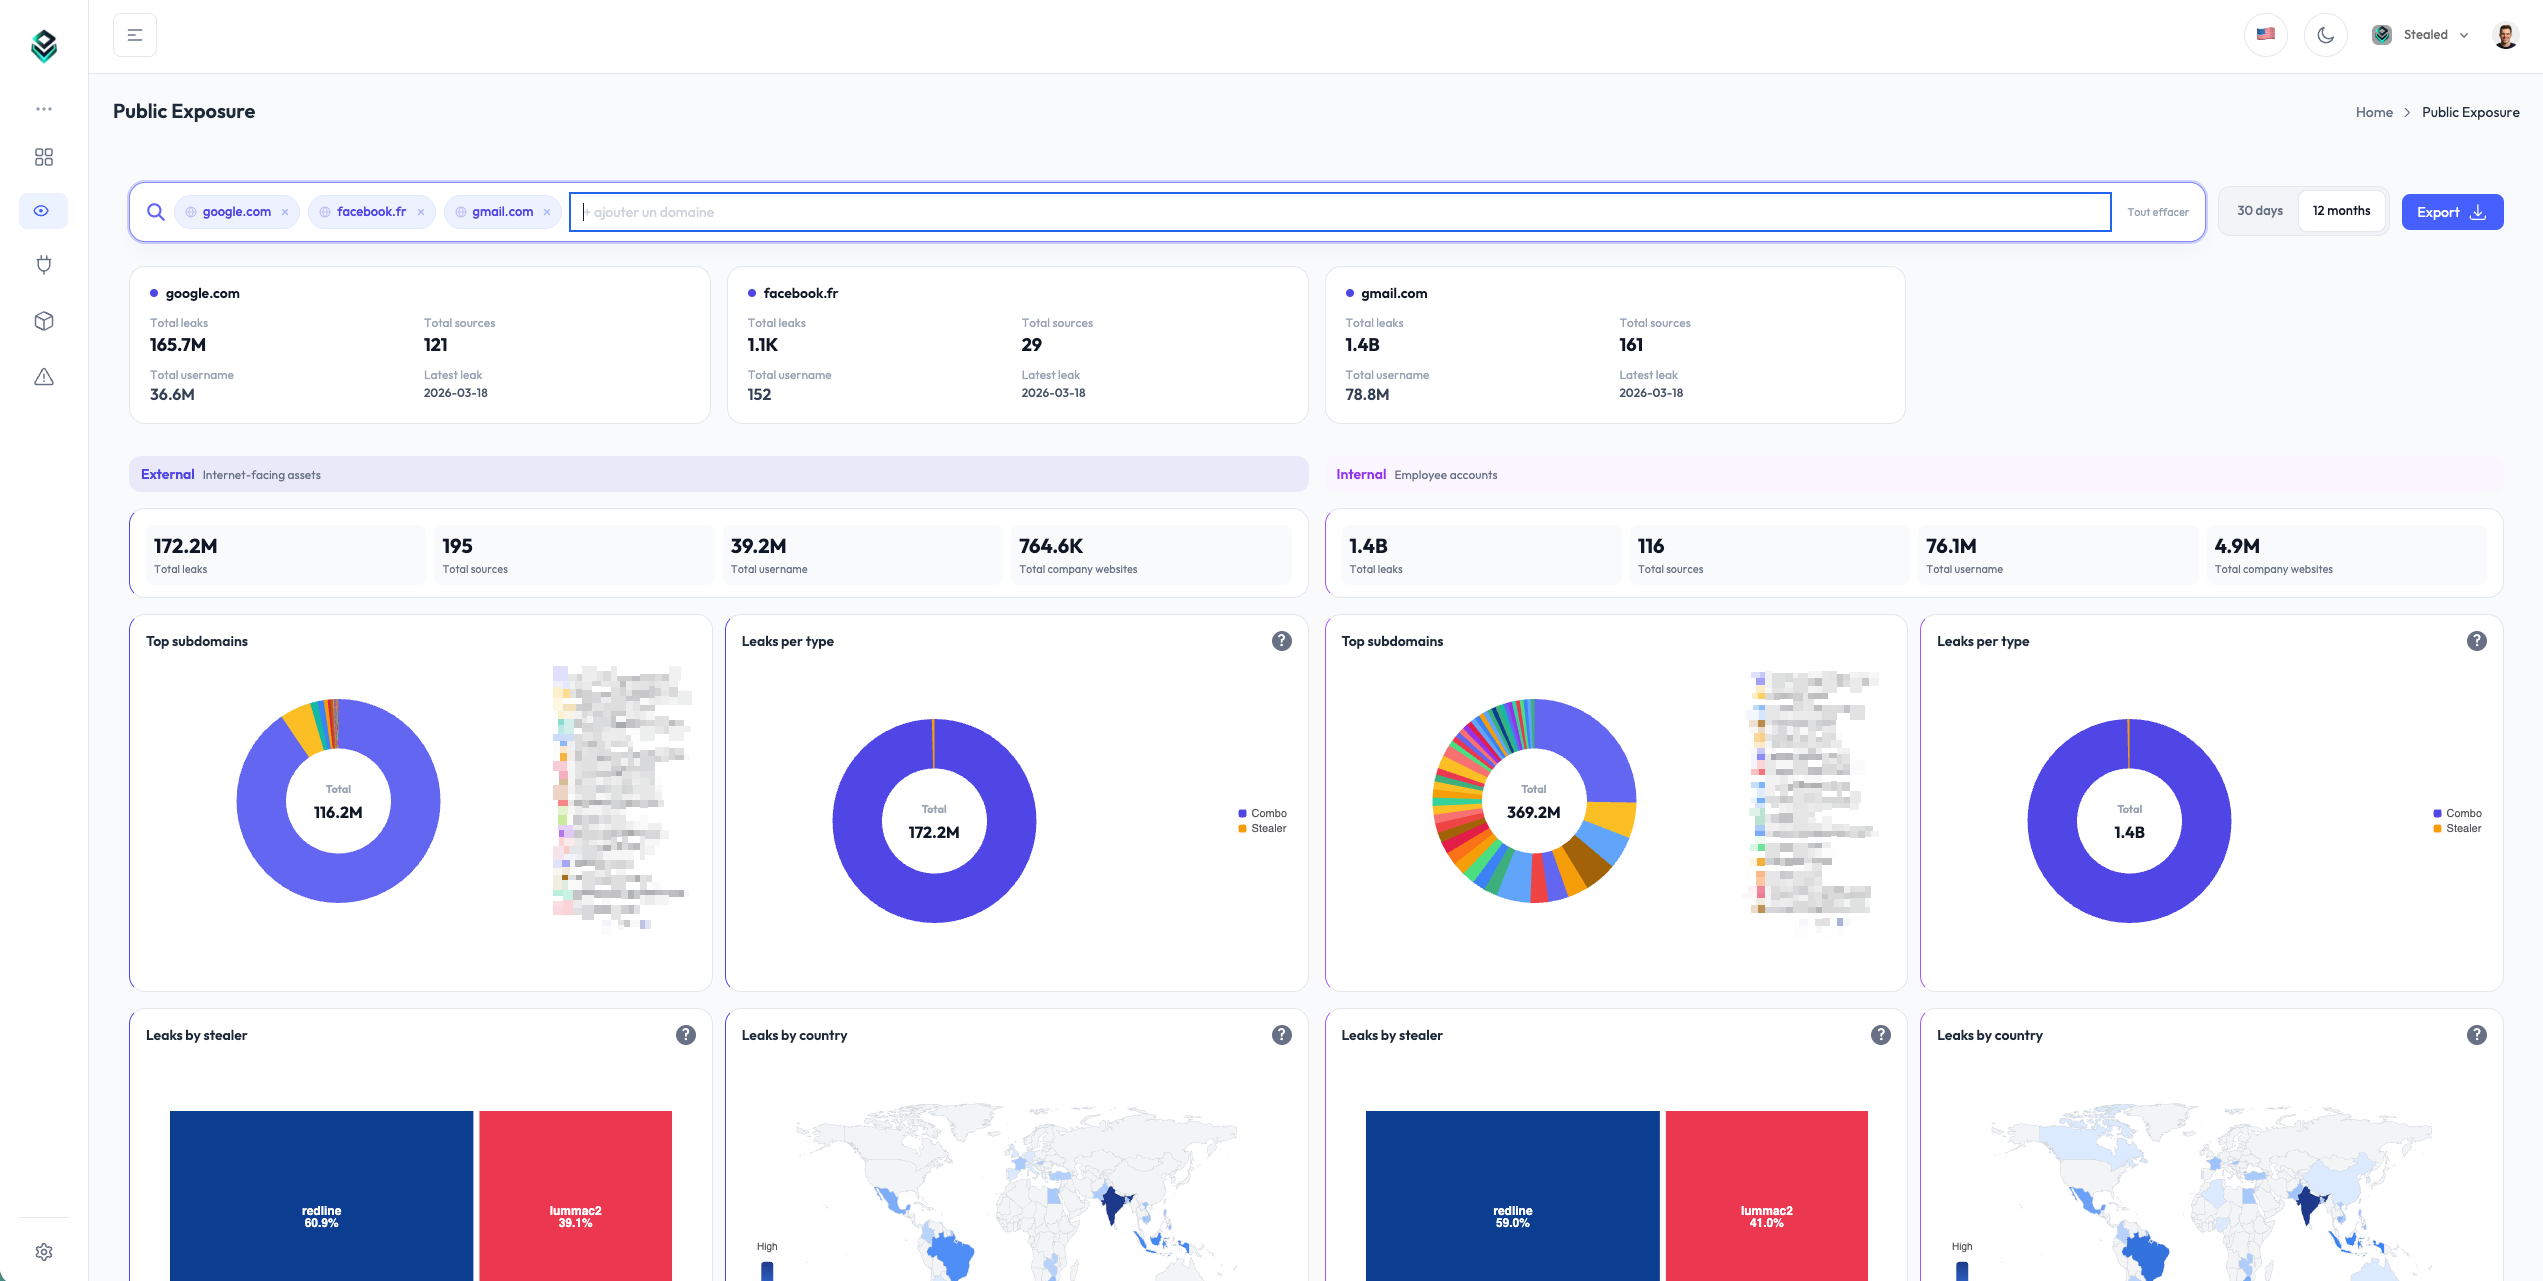
Public Exposure: multi-domain scan

The Public Exposure page lets you look up exposure statistics for any domain, including ones you don’t own. No individual data is shown — only aggregated metrics.

  • Compare multiple domains side by side
  • Separate External view (internet-exposed assets) and Internal view (employee accounts)
  • Per-domain metrics: total leaks, sources, usernames, company websites
  • Breakdown by subdomain, leak type, stealer family, country
  • Adjustable timeframe: 30 days or 12 months

Public Exposure: multi-domain scan

New chart system

All charts have been rebuilt on a new visualization library for better readability and a more consistent interface.

  • World map of leaks by country with heatmap
  • Stealer family treemap
  • Ranked horizontal bars for Top-N (replaces pie charts)
  • Side panel to explore details without leaving the main view
  • Drill-down navigation: click an identifier to see all of its occurrences
  • Dark mode across every chart

New chart system

Performance

Load times have been completely reworked. Previously, the dashboard became unusable beyond a few tens of thousands of leaks. That is no longer the case: tables now use server-side pagination with built-in search and sort, and the dashboard stays smooth regardless of volume.

Data retention

Retention moves from 14 days to unlimited. You keep the entirety of your leak history with no data loss.

PDF export

The new charts export faithfully to PDF with automatic detection of which sections to include.